Wakarusa: Fire Incidents, Indiana (IN)
Where are fire incidents reported in Wakarusa, IN
Something went wrong! Please refresh the page.
|
| |||||||||||||||||||||||||||||||||||||||||||||||||||||||||||||||||||||||||||||||||||||||||||||||||||||||||||||
2002 - 2018 National Fire Incident Reporting System (NFIRS) incidents
- Incident types reported to NFIRS in Wakarusa, IN
- 53955.3%Rescue & EMS
- 25926.6%Fire
- 828.4%Hazardous Condition
- 575.8%False Alarm
- 242.5%Good Intent Call
- 101.0%Service Call
- 30.3%Overpressure Rupture
- 10.1%Special Incident
- Fire incident types reported to NFIRS in Wakarusa, IN
- 10440.2%Outside Fires
- 8834.0%Structure Fires
- 4015.4%Other
- 2710.4%Mobile Property/Vehicle Fires
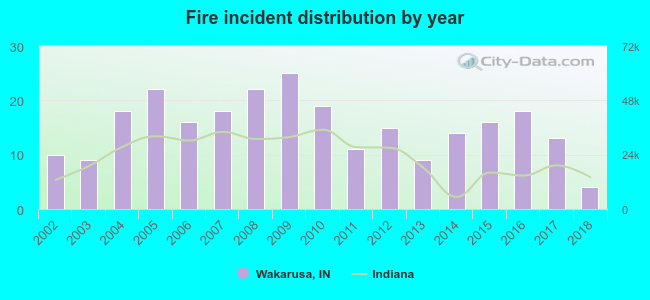 According to the data from the years 2002 - 2018 the average number of fires per year is 15. The highest number of fires - 25 took place in 2009, and the least - 4 in 2018. The data has a dropping trend.
 32.4% incidents where reported in the morning and 67.6% in the evening. The most fires (20.1%) took place on Wednesday, and the least (6.6%) on Sunday.
 According to the 259 fire incident reports from years 2002 - 2018 most fires (14.3%) took place during April, and the least (3.5%) in February.
 Out of all 975 cases reported during the years 2002 - 2018, the most belonged to the categories: Rescue & EMS (55.3%), Fire (26.6%), and Hazardous Condition (8.4%).
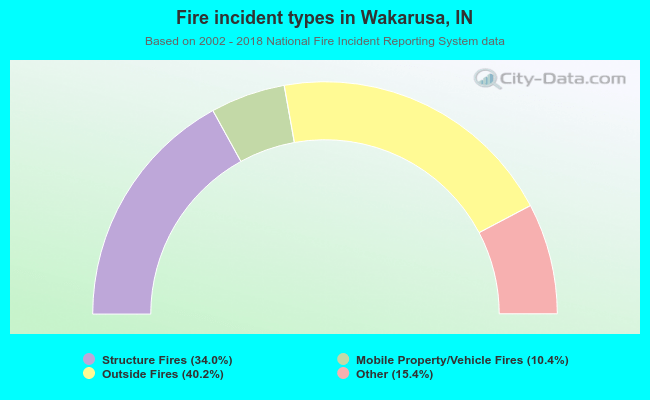 When looking into fire subcategories, the most reports belonged to: Outside Fires (40.2%), and Structure Fires (34.0%).