Walland: Fire Incidents, Tennessee (TN)
Where are fire incidents reported in Walland, TN
Something went wrong! Please refresh the page.
|
| |||||||||||||||||||||||||||||||||||||||||||||||||||||||||||||||||||||||||||||||||||||||||||||||||||||||||||||
2005 - 2018 National Fire Incident Reporting System (NFIRS) incidents
- Incident types reported to NFIRS in Walland, TN
- 23431.7%Fire
- 21629.3%Good Intent Call
- 13618.4%Hazardous Condition
- 638.5%Rescue & EMS
- 476.4%Service Call
- 425.7%False Alarm
- Fire incident types reported to NFIRS in Walland, TN
- 10544.9%Outside Fires
- 7732.9%Structure Fires
- 4519.2%Mobile Property/Vehicle Fires
- 73.0%Other
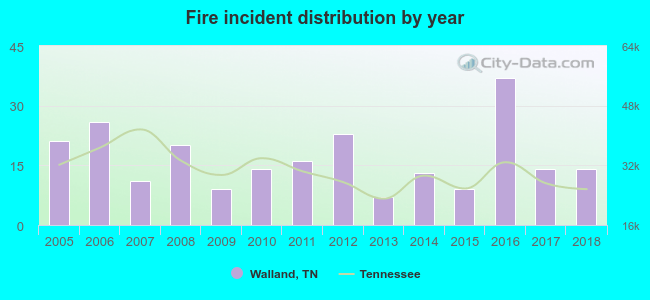 According to the data from the years 2005 - 2018 the average number of fires per year is 17. The highest number of fire incidents - 37 took place in 2016, and the least - 7 in 2013. The data has a declining trend.
 According to the data from the years 2005 - 2018 the average number of fire-related yearly deaths is 0. The highest number of reported deaths - 3 took place in 2018, and the lowest - 0 in 2005. The data has a growing trend.
 30.3% incidents where reported in the morning and 69.7% in the evening. The most fires (19.7%) took place on Saturday, and the least (11.1%) on Monday.
 Based on the 234 fire incidents from years 2005 - 2018 most fires (17.9%) took place during November, and the least (4.7%) in December.
 Out of all 738 cases reported during the years 2005 - 2018, the most belonged to the categories: Fire (31.7%), Service Call (29.3%), and Rescue & EMS (18.4%).
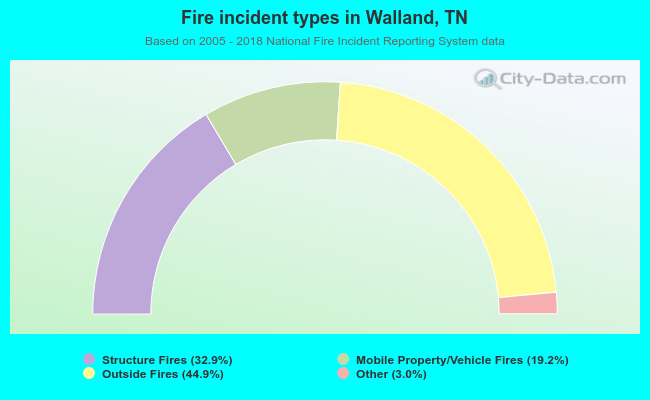 When looking into fire subcategories, the most incidents belonged to: Outside Fires (44.9%), and Structure Fires (32.9%).