Walnut Grove: Fire Incidents, Minnesota (MN)
Where are fire incidents reported in Walnut Grove, MN
Something went wrong! Please refresh the page.
|
| |||||||||||||||||||||||||||||||||||||||||||||||||||||||||||||||||||||||||||||||||||||||||||||||||||||||||||||
2005 - 2018 National Fire Incident Reporting System (NFIRS) incidents
- Incident types reported to NFIRS in Walnut Grove, MN
- 11281.8%Fire
- 107.3%Rescue & EMS
- 53.6%Hazardous Condition
- 42.9%Good Intent Call
- 21.5%Service Call
- 21.5%Severe Weather
- 10.7%Overpressure Rupture
- 10.7%False Alarm
- Fire incident types reported to NFIRS in Walnut Grove, MN
- 5851.8%Structure Fires
- 3127.7%Outside Fires
- 1412.5%Other
- 98.0%Mobile Property/Vehicle Fires
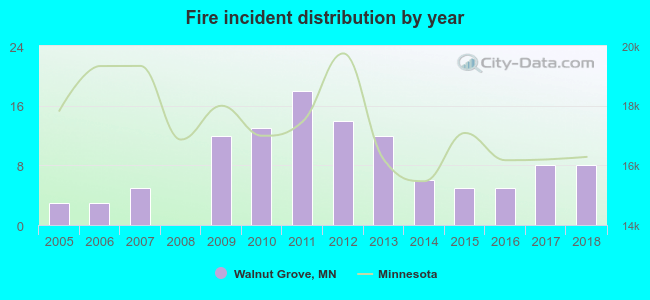 Based on the data from the years 2005 - 2018 the average number of fires per year is 8. The highest number of reported fires - 18 took place in 2011, and the least - 0 in 2008. The data has a rising trend.
 33.0% incidents where reported in the morning and 67.0% in the evening. The most fires (18.8%) took place on Wednesday, and the least (11.6%) on Tuesday.
 Based on the 112 fire incident reports from years 2005 - 2018 most fires (18.8%) took place during February, and the least (2.7%) in June.
 Out of all 137 cases reported during the years 2005 - 2018, the most belonged to the categories: Fire (81.8%), Rescue & EMS (7.3%), and Hazardous Condition (3.6%).
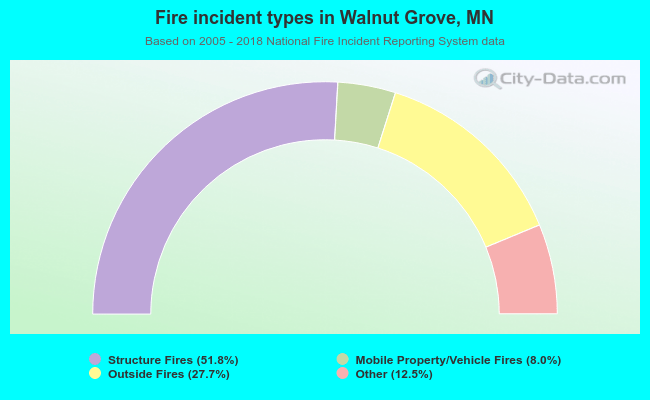 When looking into fire subcategories, the most incidents belonged to: Structure Fires (51.8%), and Outside Fires (27.7%).