Walton: Fire Incidents, Indiana (IN)
Where are fire incidents reported in Walton, IN
Something went wrong! Please refresh the page.
|
| |||||||||||||||||||||||||||||||||||||||||||||||||||||||||||||||||||||||||||||||||||||||||||||||||||||||||||||
2002 - 2016 National Fire Incident Reporting System (NFIRS) incidents
- Incident types reported to NFIRS in Walton, IN
- 37749.2%Rescue & EMS
- 28236.8%Fire
- 435.6%Hazardous Condition
- 425.5%Good Intent Call
- 131.7%Service Call
- 60.8%False Alarm
- 30.4%Severe Weather
- 10.1%Special Incident
- Fire incident types reported to NFIRS in Walton, IN
- 13046.1%Outside Fires
- 9433.3%Structure Fires
- 4114.5%Mobile Property/Vehicle Fires
- 176.0%Other
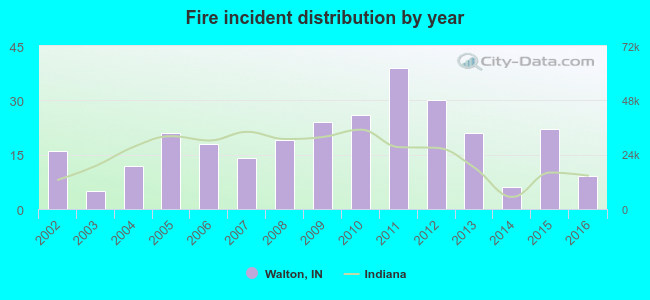 According to the data from the years 2002 - 2016 the average number of fires per year is 19. The highest number of fires - 39 took place in 2011, and the least - 5 in 2003. The data has a dropping trend.
 25.5% incidents where reported in the morning and 74.5% in the evening. The most fires (16.3%) took place on Monday, and the least (9.9%) on Friday.
 According to the 282 fire incident reports from years 2002 - 2016 most fires (13.8%) took place during March, and the least (5.3%) in February.
 Out of all 767 cases reported during the years 2002 - 2016, the most belonged to the categories: Overpressure Rupture (49.2%), Fire (36.8%), and Rescue & EMS (5.6%).
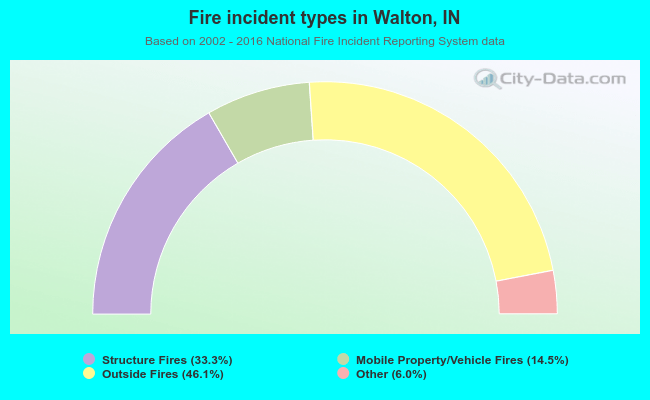 When looking into fire subcategories, the most reports belonged to: Outside Fires (46.1%), and Structure Fires (33.3%).