Warden: Fire Incidents, Washington (WA)
Where are fire incidents reported in Warden, WA
Something went wrong! Please refresh the page.
|
| |||||||||||||||||||||||||||||||||||||||||||||||||||||||||||||||||||||||||||||||||||||||||||||||||||||||||||||
| Other | 103 | |||||||||||||||||||||||||||||||||||||||||||||||||||||||||||||||||||||||||||||||||||||||||||||||||||||||||||||
2005 - 2018 National Fire Incident Reporting System (NFIRS) incidents
- Incident types reported to NFIRS in Warden, WA
- 57948.3%Rescue & EMS
- 39532.9%Fire
- 786.5%Good Intent Call
- 655.4%False Alarm
- 534.4%Hazardous Condition
- 272.3%Service Call
- 20.2%Overpressure Rupture
- Fire incident types reported to NFIRS in Warden, WA
- 23559.5%Outside Fires
- 6115.4%Structure Fires
- 5614.2%Other
- 4310.9%Mobile Property/Vehicle Fires
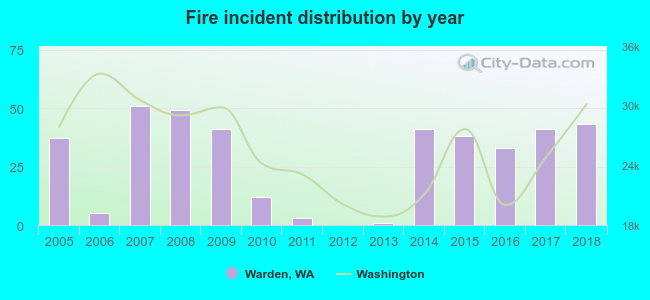 Based on the data from the years 2005 - 2018 the average number of fires per year is 28. The highest number of fire incidents - 51 took place in 2007, and the least - 0 in 2012. The data has a rising trend.
 31.6% incidents where reported in the morning and 68.4% in the evening. The most fires (17.7%) took place on Thursday, and the least (11.9%) on Sunday.
 Based on the 395 fires from years 2005 - 2018 most fires (15.7%) took place during July, and the least (2.8%) in February.
 Out of all 1,199 cases reported during the years 2005 - 2018, the most belonged to the categories: Rescue & EMS (48.3%), Fire (32.9%), and Good Intent Call (6.5%).
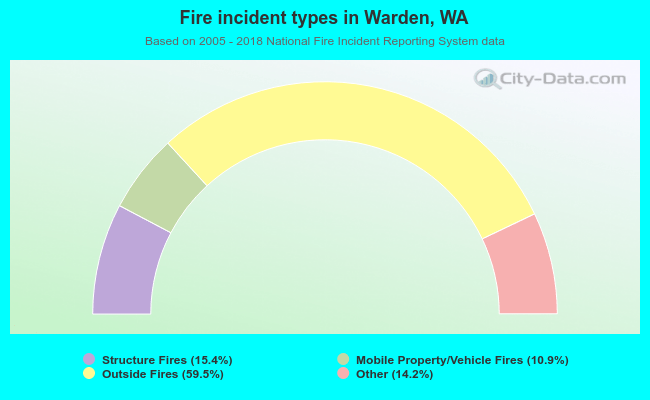 When looking into fire subcategories, the most reports belonged to: Outside Fires (59.5%), and Structure Fires (15.4%).