Waretown: Fire Incidents, New Jersey (NJ)
Where are fire incidents reported in Waretown, NJ
Something went wrong! Please refresh the page.
|
| |||||||||||||||||||||||||||||||||||||||||||||||||||||||||||||||||||||||||||||||||||||||||||||||||||||||||||||
2003 - 2018 National Fire Incident Reporting System (NFIRS) incidents
- Incident types reported to NFIRS in Waretown, NJ
- 32557.5%Hazardous Condition
- 21037.2%Fire
- 152.7%Service Call
- 81.4%Good Intent Call
- 50.9%Rescue & EMS
- 10.2%False Alarm
- 10.2%Severe Weather
- Fire incident types reported to NFIRS in Waretown, NJ
- 10951.9%Structure Fires
- 6631.4%Outside Fires
- 3114.8%Mobile Property/Vehicle Fires
- 41.9%Other
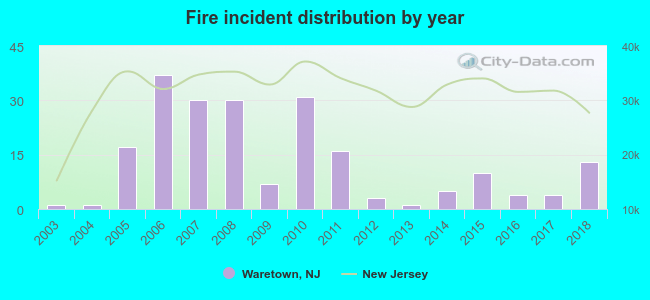 According to the data from the years 2003 - 2018 the average number of fires per year is 13. The highest number of reported fire incidents - 37 took place in 2006, and the least - 1 in 2003. The data has a growing trend.
 35.2% incidents where reported in the morning and 64.8% in the evening. The most fires (17.6%) took place on Thursday, and the least (11.4%) on Wednesday.
 Based on the 210 fire incidents from years 2003 - 2018 most fires (13.8%) took place during December, and the least (4.3%) in October.
 Out of all 565 cases reported during the years 2003 - 2018, the most belonged to the categories: Rescue & EMS (57.5%), Fire (37.2%), and Hazardous Condition (2.7%).
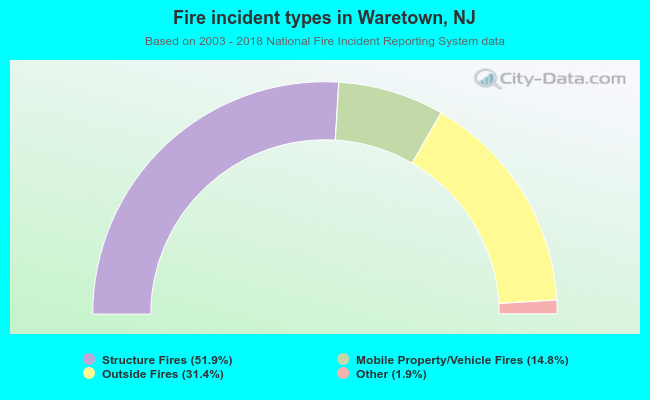 When looking into fire subcategories, the most reports belonged to: Structure Fires (51.9%), and Outside Fires (31.4%).