Washington: Fire Incidents, Missouri (MO)
Where are fire incidents reported in Washington, MO
Something went wrong! Please refresh the page.
|
| |||||||||||||||||||||||||||||||||||||||||||||||||||||||||||||||||||||||||||||||||||||||||||||||||||||||||||||
2002 - 2018 National Fire Incident Reporting System (NFIRS) incidents
- Incident types reported to NFIRS in Washington, MO
- 1,99334.6%Hazardous Condition
- 1,08718.9%Rescue & EMS
- 1,02617.8%Fire
- 70712.3%False Alarm
- 4658.1%Good Intent Call
- 4537.9%Service Call
- 260.5%Severe Weather
- Fire incident types reported to NFIRS in Washington, MO
- 39438.4%Structure Fires
- 32832.0%Outside Fires
- 20319.8%Mobile Property/Vehicle Fires
- 1019.8%Other
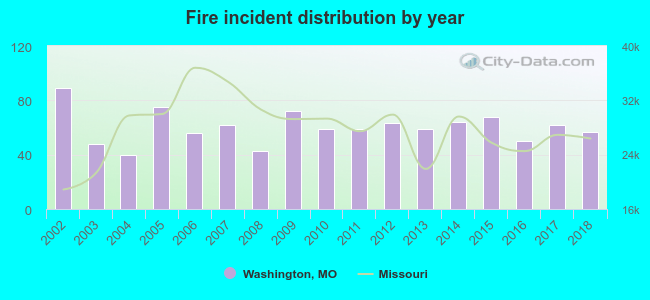 According to the data from the years 2002 - 2018 the average number of fires per year is 60. The highest number of reported fires - 89 took place in 2002, and the least - 40 in 2004. The data has a declining trend.
The average number of yearly fire incidents per 10k residents in Washington, MO compared to nearest cities:
(Note: Based on data for the last 3 years, including only cities with population 5,000 and above)
| Washington: | 40.2 |
| Union: | 74.9 |
| Pacific: | 45.0 |
| Warrenton: | 27.3 |
| Wildwood: | 16.8 |
| Wentzville: | 33.2 |
| Eureka: | 47.4 |
| Dardenne Prairie: | 19.6 |
| Weldon Spring: | 1.8 |
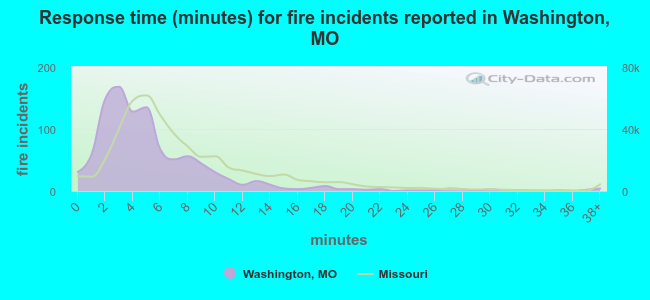 The median response time based on all reported fire incidents is 4 minutes. This is lower than the Missouri median value.
The median response time in Washington, MO compared to nearest cities:
(Note: Based on data for all years, including only cities with at least 500 fire incidents)
| Washington: | 4 minutes |
| Union: | 8 minutes |
| Pacific: | 7 minutes |
| Wright City: | 11 minutes |
| Warrenton: | 11 minutes |
| Wildwood: | 6 minutes |
| Wentzville: | 8 minutes |
| Gerald: | 11 minutes |
| Eureka: | 8 minutes |
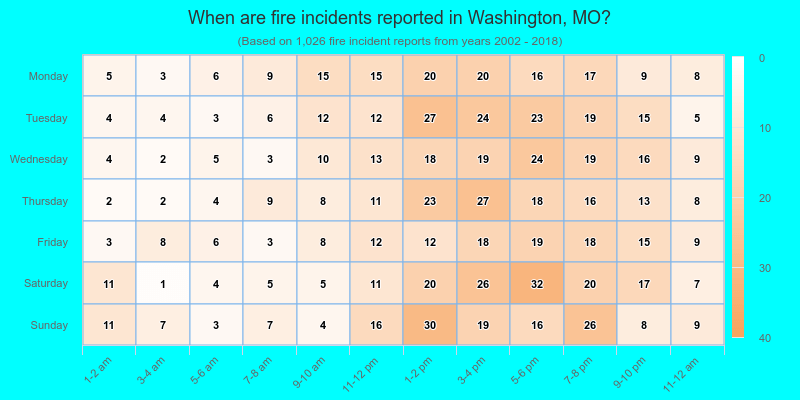
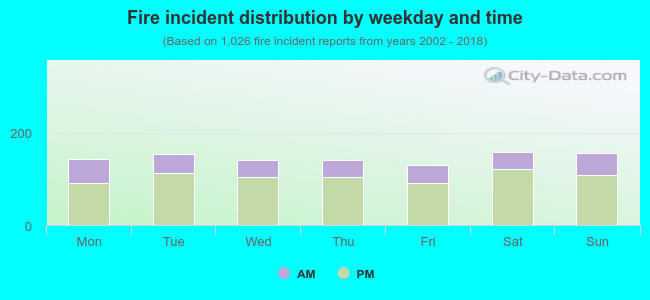 28.5% incidents where reported in the morning and 71.5% in the evening. The most fires (15.5%) took place on Saturday, and the least (12.8%) on Friday.
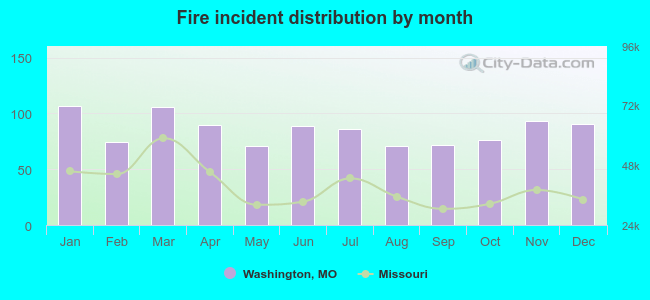 According to the 1,026 fire incidents from years 2002 - 2018 most fires (10.4%) took place during January, and the least (6.9%) in May.
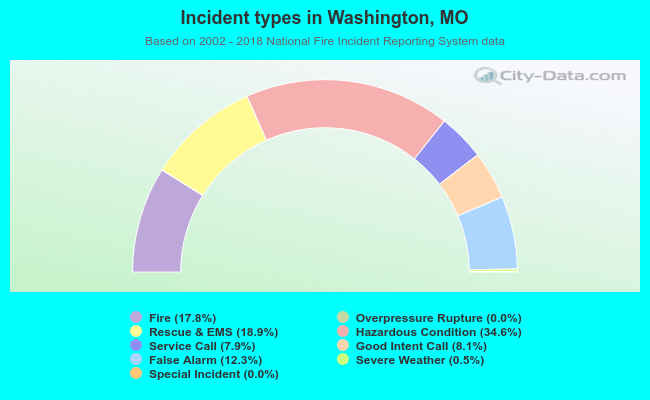 Out of all 5,760 cases reported during the years 2002 - 2018, the most belonged to the categories: Hazardous Condition (34.6%), Rescue & EMS (18.9%), and Fire (17.8%).
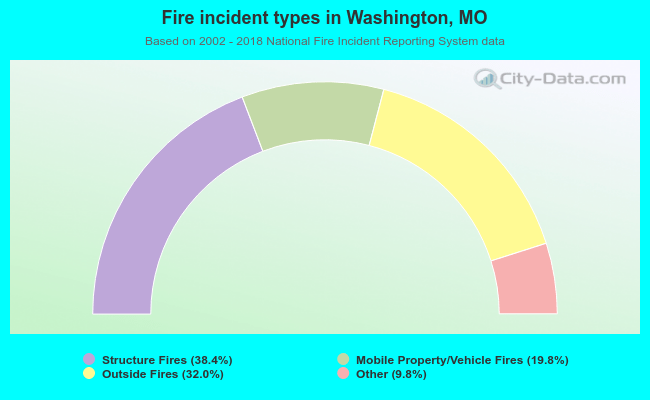 When looking into fire subcategories, the most incidents belonged to: Structure Fires (38.4%), and Outside Fires (32.0%).