| Fire incidents reported |
|---|
| Sreet name | Count |
|---|
| CRIPPLE CREEK LOOP | 40 | | WATAUGA RD | 36 | | PERSINGER DR | 28 | | PINEY FLATS RD | 24 | | RIGGS RD | 20 | | 4TH AVE | 18 | | BRISTOL HWY | 18 | | OLD WATAUGA RD | 18 | | CRIPPLE CREEK RD | 14 | | GARLAND BRANCH RD | 10 | | RIVERVIEW AVE | 8 | | CHARLES SMITH RD | 6 | | MAPLE TREE LN | 6 | | PETE SLAGLE RD | 6 | | SUNFLOWER LANE | 6 | | CBM CAMP RD | 4 | | EAST RIVERVIEW AVE | 4 | | KEG MOTTERN RD | 4 | | MAPLE TREE LANE | 4 | | RASNICK HOLLOW RD | 4 | | ROCK HILL RD | 4 | | SHANE LN | 4 | | WADE BULLA RD | 4 | | 2005 SUNFLOWER LANE | 2 | | 205 GARLAND BRANCH ROAD | 2 |
| | | Fire incidents reported |
|---|
| Sreet name | Count |
|---|
| 300 CRIPPLE CREEK LOOP | 2 | | 3RD ST | 2 | | 400 HWY | 2 | | 5TH AVE | 2 | | 5TH ST | 2 | | 604 CRIPPLE CREEK ROAD | 2 | | 657 HERB HODGE RD. | 2 | | 9TH ST EXT | 2 | | AUSTIN SPRINGS ROAD | 2 | | AVIS LANE | 2 | | BARE HOLLOW RD | 2 | | CARR CEMETARY RD | 2 | | CARR RD | 2 | | CHARLIE BARE RD | 2 | | CRIPPLE CREEK | 2 | | CRIPPLE CREEK LOOP | 2 | | CRIPPLE CREEK RD | 2 | | DANNY MATHES RD | 2 | | EIGHTH ST | 2 | | FOREST PRIVATE DR | 2 | | HICKS HILL RD | 2 | | HIDDEN VALLEY RD | 2 | | HIGHWAY 400 | 2 | | HILTON HILL RD | 2 | | |
|
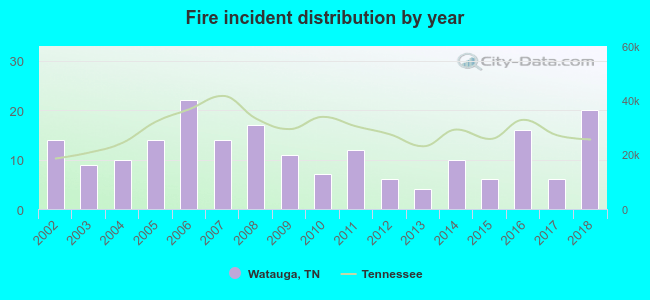 According to the data from the years 2002 - 2018 the average number of fires per year is 12. The highest number of reported fire incidents - 22 took place in 2006, and the least - 4 in 2013. The data has a rising trend.
 36.4% incidents where reported in the morning and 63.6% in the evening. The most fires (21.2%) took place on Wednesday, and the least (10.6%) on Friday.
 According to the 198 reports from years 2002 - 2018 most fires (12.6%) took place during March, and the least (3.5%) in August.
 Out of all 610 cases reported during the years 2002 - 2018, the most belonged to the categories: Fire (32.5%), Rescue & EMS (28.4%), and Good Intent Call (19.7%).
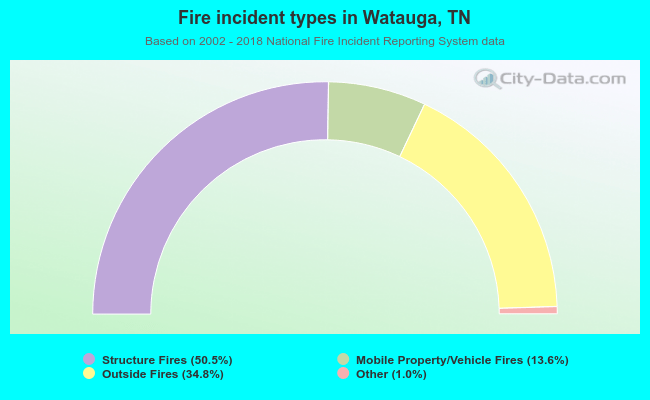 When looking into fire subcategories, the most reports belonged to: Structure Fires (50.5%), and Outside Fires (34.8%).