| Fire incidents reported |
|---|
| Sreet name | Count |
|---|
| ST RT 339 | 12 | | ST RT 676 EAST | 10 | | KLINGER RD | 8 | | 1024 MCNEAL RD | 6 | | 1595 SPARLING RD | 6 | | LUKE CHUTE ROAD | 6 | | MAIN ST. | 6 | | PLUM RUN RD | 6 | | SPARLING RD. | 6 | | ST. RT. 676 EAST | 6 | | WATERFORD RD. | 6 | | 1213 KLINGER RD | 4 | | 1595 SPARLING RD. | 4 | | 5280 BUCHANON ROAD | 4 | | 816 LUKE CHUTE RD | 4 | | CAMP HERVIDA RD | 4 | | DERBY RD. | 4 | | KLOES RD. | 4 | | LOIS LN | 4 | | MAIN ST | 4 | | ST. RT. 339 | 4 | | STATE RT. 676 | 4 | | WATERFORD ROAD | 4 | | WATERTOWN RD | 4 | | 1024 MCNEAL | 2 |
| | | Fire incidents reported |
|---|
| Sreet name | Count |
|---|
| 1242 RIGTEOUS RIDGE RD | 2 | | 12995 SR 676 | 2 | | 1301 MILNER RD | 2 | | 13191 WATERFORD RD. | 2 | | 13323 SR 339 | 2 | | 135 CENTER ST | 2 | | 13575 ST. RT. 676 | 2 | | 14350 WATERFORD RD. | 2 | | 14350 WATERFORD ROAD | 2 | | 14400 MUSKINGUM RIVER RD | 2 | | 14855 WATERFORD RD. | 2 | | 15 HICKORY LANE | 2 | | 1501 SPARLING RD | 2 | | 1545 CORY HILL RD. | 2 | | 1580 MCNEAL RD | 2 | | 1595 SPARLING ROAD | 2 | | 166 LUKE CHUTE RD. | 2 | | 1764 RIGHTEOUS RIDGE RD | 2 | | 17790 STATE ROUTE #339 | 2 | | 1785 HAYESVILLE RD | 2 | | 17891 ST. RT. 339 | 2 | | 18260 SR 339 | 2 | | 183 WASHINGTON ST. | 2 | | 1852 RIGHTEOUS RIDGE RD | 2 | | |
|
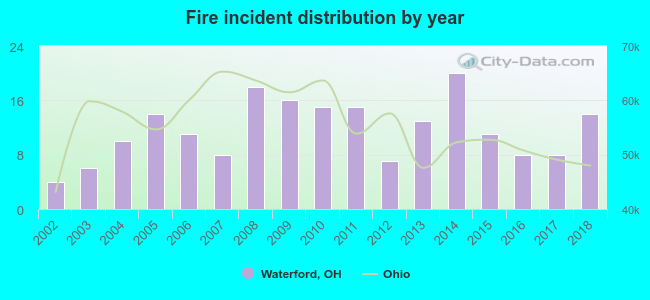 Based on the data from the years 2002 - 2018 the average number of fires per year is 12. The highest number of fires - 20 took place in 2014, and the least - 4 in 2002. The data has a rising trend.
 Based on the reports from the years 2002 - 2018 the average number of fire-related fatalities per year is 0. The highest number of reported deaths - 3 took place in 2016, and the lowest - 0 in 2002. The data has a constant trend.
 31.3% incidents where reported in the morning and 68.7% in the evening. The most fires (20.2%) took place on Saturday, and the least (7.6%) on Wednesday.
 According to the 198 incident reports from years 2002 - 2018 most fires (16.2%) took place during March, and the least (3.5%) in September.
 Out of all 517 cases reported during the years 2002 - 2018, the most belonged to the categories: Fire (38.3%), Hazardous Condition (33.5%), and Rescue & EMS (16.2%).
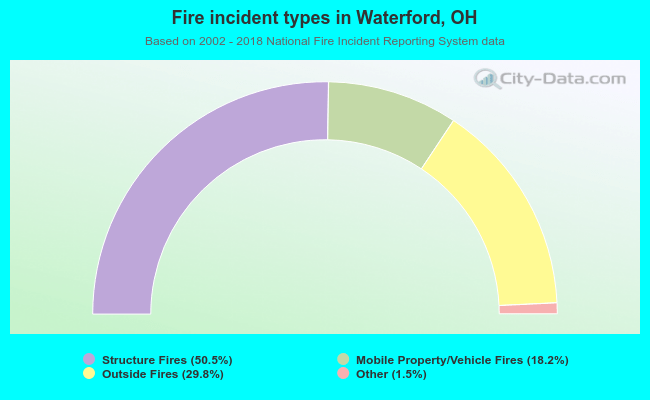 When looking into fire subcategories, the most incidents belonged to: Structure Fires (50.5%), and Outside Fires (29.8%).