Watertown: Fire Incidents, New York (NY)
Where are fire incidents reported in Watertown, NY
Something went wrong! Please refresh the page.
| Fire incidents reported | |
|---|---|
| Sreet name | Count |
| ARSENAL ST | 200 |
| STATE ST | 180 |
| WASHINGTON ST | 152 |
| MAIN ST | 136 |
| COFFEEN ST | 90 |
| HUNTINGTON ST | 86 |
| MILL ST | 86 |
| FRANKLIN ST | 76 |
| MASSEY ST | 76 |
| ACADEMY ST | 72 |
| FLOWER AVE | 66 |
| US RT 11 | 60 |
| FACTORY ST | 56 |
| OHIO ST | 56 |
| MECHANIC ST | 52 |
| BRONSON ST | 48 |
| HAMILTON ST | 46 |
| RUTLAND ST | 44 |
| HIGH ST | 42 |
| MEADOW ST | 42 |
| GOTHAM ST | 40 |
| WINSLOW ST | 40 |
| NYS RT 37 | 36 |
| STONE ST | 36 |
| WATER ST | 36 |
| COOPER ST | 32 |
| BOYD ST | 30 |
| CENTRAL ST | 30 |
| INDIANA AVE | 30 |
| LERAY ST | 30 |
| Other | 619 |
2002 - 2018 National Fire Incident Reporting System (NFIRS) incidents
- Incident types reported to NFIRS in Watertown, NY
- 14,07744.8%Rescue & EMS
- 7,88025.1%Hazardous Condition
- 3,1109.9%False Alarm
- 2,6258.4%Fire
- 1,7045.4%Service Call
- 1,6545.3%Good Intent Call
- 1550.5%Overpressure Rupture
- 1260.4%Severe Weather
- 940.3%Special Incident
- Fire incident types reported to NFIRS in Watertown, NY
- 1,22746.7%Structure Fires
- 83331.7%Outside Fires
- 36413.9%Mobile Property/Vehicle Fires
- 2017.7%Other
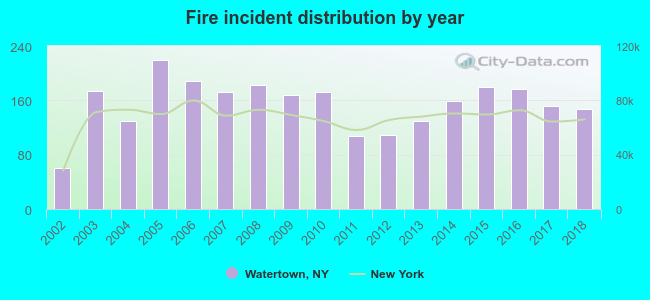 Based on the data from the years 2002 - 2018 the average number of fire incidents per year is 154. The highest number of reported fire incidents - 219 took place in 2005, and the least - 60 in 2002. The data has a growing trend.
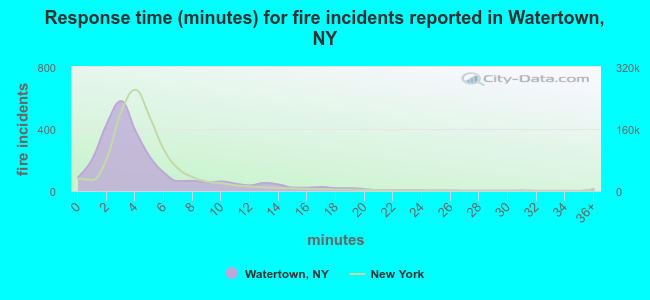 The median response time based on all reported fire incidents is 4 minutes. This is comparable to the state median value.
The median response time in Watertown, NY compared to nearest cities:
(Note: Based on data for all years, including only cities with at least 500 fire incidents)
| Watertown: | 4 minutes |
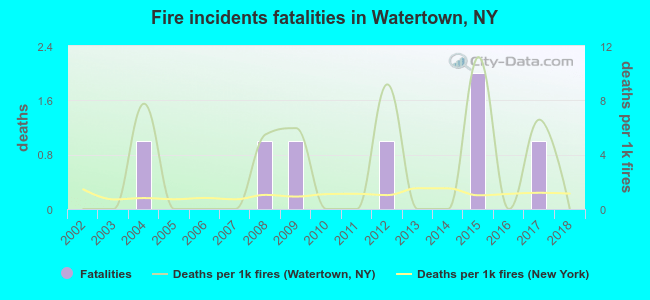 Based on the data from the years 2002 - 2018 the average number of fire-related yearly deaths is 0. The highest number of reported deaths - 2 took place in 2015, and the lowest - 0 in 2002. The data has a constant trend.
The average number of fatalities per 1,000 fires is 3. This indicator was the highest - 11 in 2015, and the lowest 0 in 2002. The trend for fatalities per 1,000 fires is constant. Compared to the state value the number of fatalities per 1,000 fire incidents is much higher.
Based on the data from the years 2002 - 2018 the average number of fire-related yearly deaths is 0. The highest number of reported deaths - 2 took place in 2015, and the lowest - 0 in 2002. The data has a constant trend.
The average number of fatalities per 1,000 fires is 3. This indicator was the highest - 11 in 2015, and the lowest 0 in 2002. The trend for fatalities per 1,000 fires is constant. Compared to the state value the number of fatalities per 1,000 fire incidents is much higher.Deaths per 1,000 incidents in Watertown, NY compared to nearest cities:
(Note: Based on data for all years, including only cities with at least 2,500 fire incidents)
| Watertown: | 2.7 |
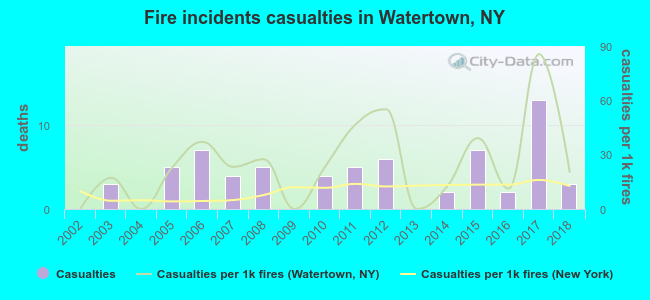 Based on the data from the years 2002 - 2018 the average number of fire-related casualties per year is 4. The highest number of casualties - 13 took place in 2017, and the lowest - 0 in 2002. The data has an increasing trend.
The average number of casualties per 1,000 fires is 25. This indicator was the highest - 86 in 2017, and the lowest 0 in 2002. The trend for casualties per 1,000 incidents is rising. Compared to the New York value the number of injuries per 1,000 fires is much higher.
Based on the data from the years 2002 - 2018 the average number of fire-related casualties per year is 4. The highest number of casualties - 13 took place in 2017, and the lowest - 0 in 2002. The data has an increasing trend.
The average number of casualties per 1,000 fires is 25. This indicator was the highest - 86 in 2017, and the lowest 0 in 2002. The trend for casualties per 1,000 incidents is rising. Compared to the New York value the number of injuries per 1,000 fires is much higher.Casualties per 1,000 incidents in Watertown, NY compared to nearest cities:
(Note: Based on data for all years, including only cities with at least 500 fire incidents)
| Watertown: | 25.1 |
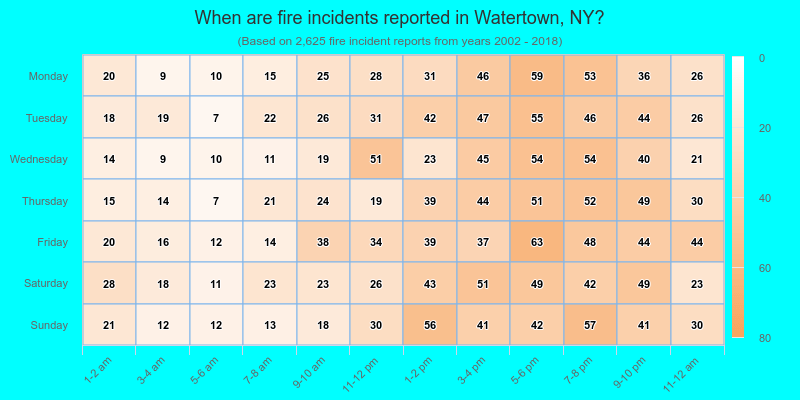
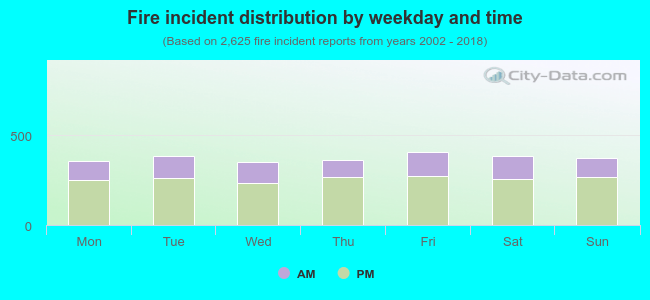 31.0% incidents where reported in the morning and 69.0% in the evening. The most fires (15.6%) took place on Friday, and the least (13.4%) on Wednesday.
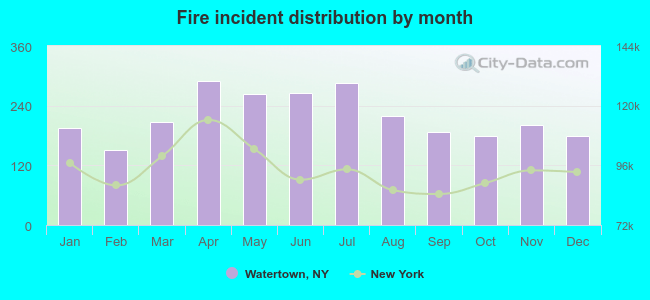 Based on the 2,625 fires from years 2002 - 2018 most fires (11.0%) took place during April, and the least (5.7%) in February.
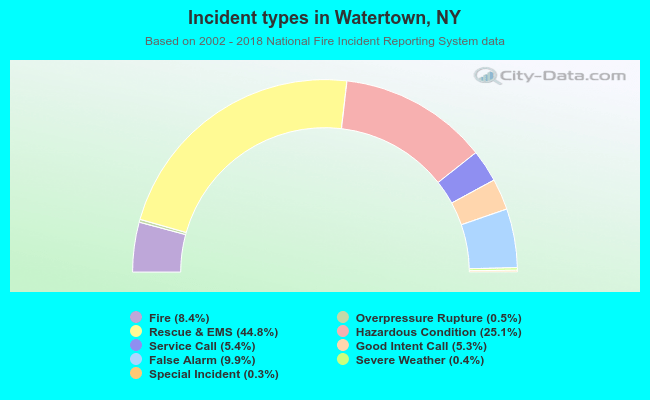 Out of all 31,425 cases reported during the years 2002 - 2018, the most belonged to the categories: Rescue & EMS (44.8%), Hazardous Condition (25.1%), and False Alarm (9.9%).
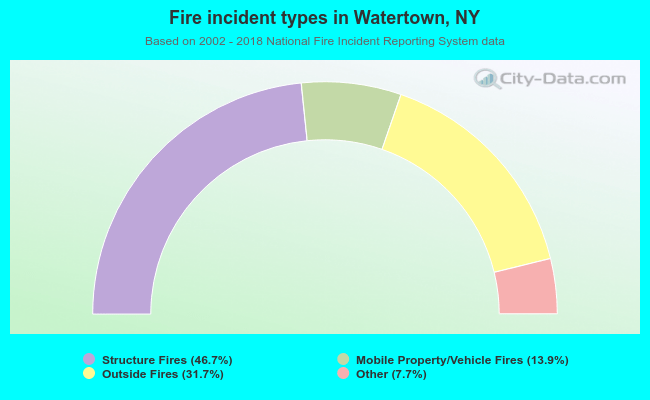 When looking into fire subcategories, the most reports belonged to: Structure Fires (46.7%), and Outside Fires (31.7%).