Watsontown: Fire Incidents, Pennsylvania (PA)
Where are fire incidents reported in Watsontown, PA
Something went wrong! Please refresh the page.
|
| |||||||||||||||||||||||||||||||||||||||||||||||||||||||||||||||||||||||||||||||||||||||||||||||||||||||||||||
2006 - 2018 National Fire Incident Reporting System (NFIRS) incidents
- Incident types reported to NFIRS in Watsontown, PA
- 11842.9%Fire
- 4114.9%Rescue & EMS
- 4114.9%Hazardous Condition
- 3914.2%Good Intent Call
- 228.0%False Alarm
- 114.0%Service Call
- 20.7%Special Incident
- 10.4%Severe Weather
- Fire incident types reported to NFIRS in Watsontown, PA
- 6555.1%Structure Fires
- 3630.5%Outside Fires
- 1210.2%Mobile Property/Vehicle Fires
- 54.2%Other
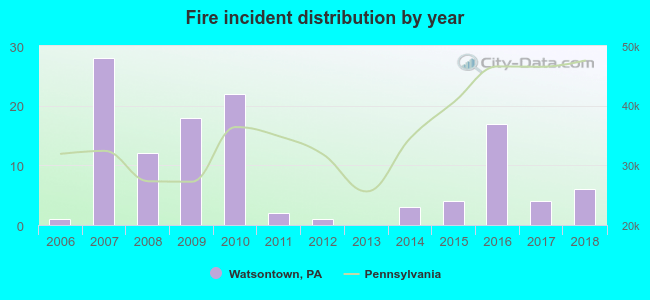 According to the data from the years 2006 - 2018 the average number of fires per year is 9. The highest number of fire incidents - 28 took place in 2007, and the least - 0 in 2013. The data has a rising trend.
 33.1% incidents where reported in the morning and 66.9% in the evening. The most fires (18.6%) took place on Saturday, and the least (9.3%) on Sunday.
 According to the 118 reports from years 2006 - 2018 most fires (22.0%) took place during March, and the least (2.5%) in February.
 Out of all 275 cases reported during the years 2006 - 2018, the most belonged to the categories: Fire (42.9%), Overpressure Rupture (14.9%), and Rescue & EMS (14.9%).
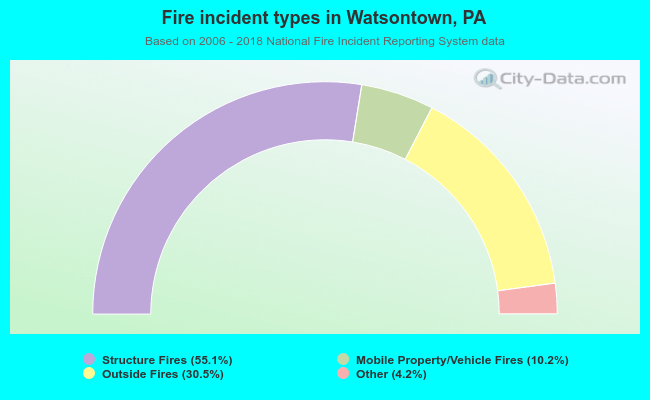 When looking into fire subcategories, the most incidents belonged to: Structure Fires (55.1%), and Outside Fires (30.5%).