| Fire incidents reported |
|---|
| Sreet name | Count |
|---|
| 113 HWY | 16 | | HWY | 10 | | COUNTY ROAD 4 | 8 | | STATE HIGHWAY 113 HWY | 8 | | 113 VLG | 6 | | ELBOW LAKE DR | 6 | | VILLAGE DRIVE | 6 | | 310TH STREET ST | 4 | | HIGHWAY 113 HWY | 4 | | STATE HIGHWAY 113 | 4 | | ST | 2 | | 100TH AVE | 2 | | 130TH AVE | 2 | | 130TH AVENUE AVE | 2 | | 140TH AVE | 2 | | 140TH AVENUE AVE | 2 | | 1ST AVENUE AVE | 2 | | 1ST STREET | 2 | | 210TH AVENUE AVE | 2 | | 210TH STREET ST | 2 | | 2590 STATE HIGHWAY 113 HWY | 2 | | 260TH STS | 2 | | 2816 WATERFRONT LANE LN | 2 | | 284 TH STREET ST | 2 | | 284TH ST. | 2 |
| | | Fire incidents reported |
|---|
| Sreet name | Count |
|---|
| 2851 SNIDER LAKE ROAD RD | 2 | | 2901 SNIDER LAKE ROAD RD | 2 | | 290TH AVE | 2 | | 293RD STREET STS | 2 | | 296TH AVE | 2 | | 296TH AVE SOUTH DAKOTA BEACH | 2 | | 29742 COYOTE ROAD | 2 | | 2ND STREET ST | 2 | | 305TH ST | 2 | | 310 TH STREET ST | 2 | | 310TH AVE | 2 | | 310TH ST | 2 | | 310TH STREET | 2 | | 320TH STREET ST | 2 | | 330TH ST | 2 | | 340 STREET ST | 2 | | 340TH ST | 2 | | 35 DR | 2 | | 35 HWY | 2 | | 350 130TH AVENUE ST | 2 | | 370 ST | 2 | | 370TH ST | 2 | | 400TH AVE | 2 | | 400TH STREET ST | 2 | | |
|
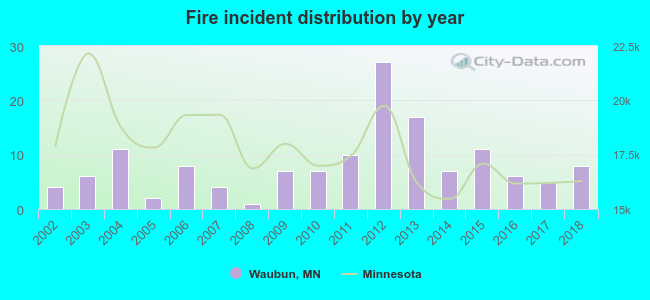 Based on the data from the years 2002 - 2018 the average number of fires per year is 8. The highest number of reported fires - 27 took place in 2012, and the least - 1 in 2008. The data has a rising trend.
 35.5% incidents where reported in the morning and 64.5% in the evening. The most fires (18.4%) took place on Wednesday, and the least (9.2%) on Monday.
 Based on the 141 fire incident reports from years 2002 - 2018 most fires (25.5%) took place during April, and the least (2.1%) in February.
 Out of all 219 cases reported during the years 2002 - 2018, the most belonged to the categories: Fire (64.4%), Overpressure Rupture (16.9%), and Service Call (11.9%).
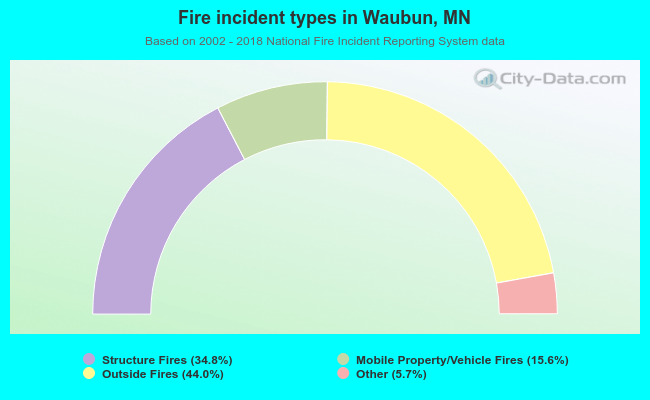 When looking into fire subcategories, the most incidents belonged to: Outside Fires (44.0%), and Structure Fires (34.8%).