| Fire incidents reported |
|---|
| Sreet name | Count |
|---|
| HWY 141 | 6 | | 215 CEDAR STREET | 4 | | 326 MAIN ST | 4 | | BERG RD | 4 | | COUNTY C HWY | 4 | | HWY 180 | 4 | | JAMROS RD | 4 | | PIKE RIVER RD | 4 | | 1018 COUNTY ROAD C | 2 | | 1022 COUNTY HWY C | 2 | | 108 CEDAR ST | 2 | | 1236 MAIN STREET | 2 | | 1236 US HWY 141 | 2 | | 1237 DIVISION ST. | 2 | | 124 CEDAR ST | 2 | | 141 AND AMBERG-WAUSAUKEE RD | 2 | | 1426 MAIN ST | 2 | | 150 CEDAR ST | 2 | | 180 HWY | 2 | | 1ST ST | 2 | | 1ST ST | 2 | | 310 ELIZABETH ST | 2 | | 511 MONROE AVE. | 2 | | 621 CHURCH ST | 2 | | 638 BEACH AVE | 2 |
| | | Fire incidents reported |
|---|
| Sreet name | Count |
|---|
| 640 MAIN ST | 2 | | 709 CHURCH ST | 2 | | 717 THIRD ST | 2 | | AMBERGWAUSAUKEE RD | 2 | | CAYLOR RD | 2 | | CAYLOR RD | 2 | | COUNTY HIGHWAY X HWY | 2 | | COUNTY HWY V | 2 | | COUNTY ROAD C | 2 | | CUTLER RD | 2 | | DIVISION ST | 2 | | DUNMAN RD 1.5 MILES EAST | 2 | | EAST LOST LAKE RD | 2 | | FOREST RD | 2 | | FOREST RD | 2 | | HWY 180 HWY | 2 | | ISLAND BLUFF TRAIL LOT#6 | 2 | | KAFKA RD | 2 | | KAIKO RD | 2 | | KOSS BRIDGE RD | 2 | | LUBKA RD | 2 | | MARTIN RD | 2 | | MEADOW CROSSING | 2 | | MOONSHINE HILL RD | 2 | | MOONSHINE HILL RD | 2 |
|
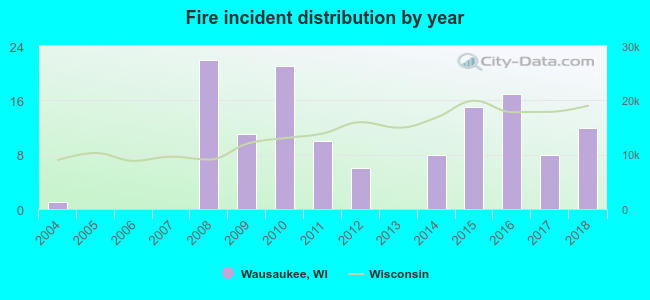 Based on the data from the years 2004 - 2018 the average number of fires per year is 9. The highest number of reported fire incidents - 22 took place in 2008, and the least - 0 in 2005. The data has an increasing trend.
 30.5% incidents where reported in the morning and 69.5% in the evening. The most fires (22.9%) took place on Saturday, and the least (8.4%) on Tuesday.
 Based on the 131 fires from years 2004 - 2018 most fires (18.3%) took place during April, and the least (3.8%) in August.
 Out of all 386 cases reported during the years 2004 - 2018, the most belonged to the categories: Fire (33.9%), Overpressure Rupture (32.4%), and Rescue & EMS (24.9%).
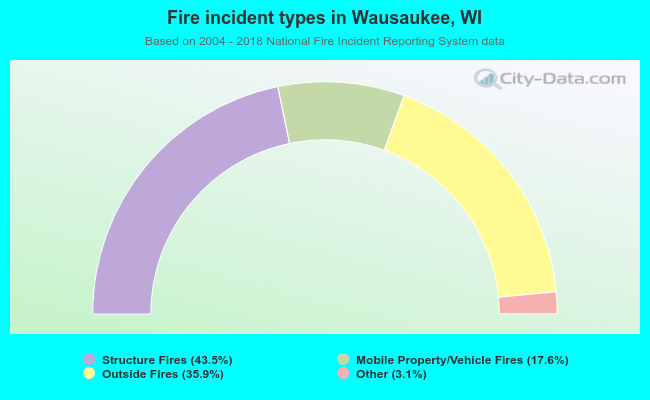 When looking into fire subcategories, the most incidents belonged to: Structure Fires (43.5%), and Outside Fires (35.9%).