Waverly: Fire Incidents, New York (NY)
Where are fire incidents reported in Waverly, NY
Something went wrong! Please refresh the page.
|
| |||||||||||||||||||||||||||||||||||||||||||||||||||||||||||||||||||||||||||||||||||||||||||||||||||||||||||||
2002 - 2018 National Fire Incident Reporting System (NFIRS) incidents
- Incident types reported to NFIRS in Waverly, NY
- 32924.4%Hazardous Condition
- 29021.5%Rescue & EMS
- 26920.0%Good Intent Call
- 18413.7%False Alarm
- 16011.9%Fire
- 1027.6%Service Call
- 110.8%Severe Weather
- Fire incident types reported to NFIRS in Waverly, NY
- 6943.1%Structure Fires
- 5635.0%Outside Fires
- 2918.1%Mobile Property/Vehicle Fires
- 63.8%Other
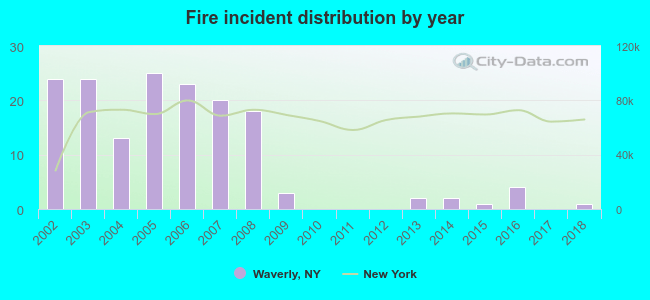 Based on the data from the years 2002 - 2018 the average number of fire incidents per year is 9. The highest number of reported fires - 25 took place in 2005, and the least - 0 in 2010. The data has a dropping trend.
 31.3% incidents where reported in the morning and 68.8% in the evening. The most fires (17.5%) took place on Saturday, and the least (11.3%) on Friday.
 Based on the 160 incident reports from years 2002 - 2018 most fires (18.1%) took place during April, and the least (3.1%) in September.
 Out of all 1,346 cases reported during the years 2002 - 2018, the most belonged to the categories: Rescue & EMS (24.4%), Overpressure Rupture (21.5%), and Service Call (20.0%).
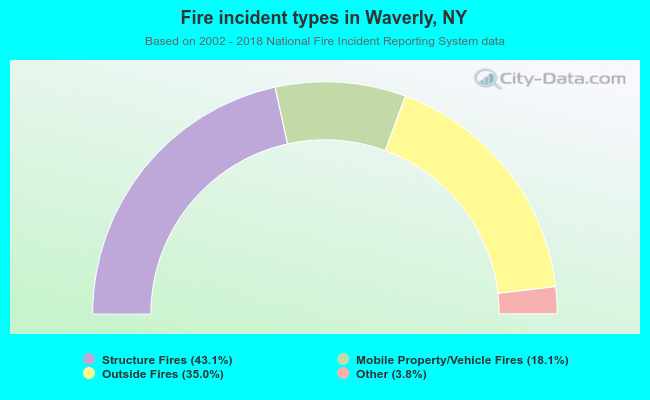 When looking into fire subcategories, the most reports belonged to: Structure Fires (43.1%), and Outside Fires (35.0%).