| Fire incidents reported |
|---|
| Sreet name | Count |
|---|
| ANNISTON BEACH RD | 50 | | ALEXANDRIA RD | 35 | | JACKSONVILLE ST | 30 | | LONGSHORE DR | 20 | | BLUE BIRD DR | 15 | | CEDAR SPRINGS RD | 15 | | CLAIRMONT DR | 15 | | PARKER BLVD | 15 | | PARKER DR | 15 | | PEACEBURG RD | 15 | | RUSSELL DR | 15 | | VAUGHN DR | 15 | | DIAL CIR | 10 | | HALLS CHAPEL RD | 10 | | KEITH DR | 10 | | LEDFORD ST | 10 | | MCCLELLAN BLVD | 10 | | MEADOW GLEN DR | 10 | | OLGA ANN DR | 10 | | ROBIN DR | 10 | | ROCKRIDGE RD | 10 | | US HWY 144 | 10 | | WARREN DR | 10 | | WEAVER LN | 10 | | WOODVALE DR | 10 |
| | | Fire incidents reported |
|---|
| Sreet name | Count |
|---|
| 225 HOLLAND-FINDLEY RD | 5 | | ALEXANDRIA-JACKSONVILLE HWY | 5 | | ALPINE DR | 5 | | ANNISTON ST | 5 | | BROOKVIEW DR | 5 | | CANE CREEK RD | 5 | | CAVE HILL RD | 5 | | CLARA | 5 | | EDGEWOOD DR DR | 5 | | FIELDSTONE WAY | 5 | | FOP LODGE RD | 5 | | FORREST DR | 5 | | FOUR MILE CHURCH RD | 5 | | GATE 5 RD | 5 | | GLORIA LN | 5 | | HALLS CHAPEL RD | 5 | | HERNDON DR | 5 | | HILLCREST DR | 5 | | HILLTOP RD | 5 | | HOWE ST | 5 | | LAKEVIEW DR | 5 | | MAIN ST | 5 | | MAPLE LN | 5 | | MARGARET ST | 5 | | MEHARG ST | 5 |
|
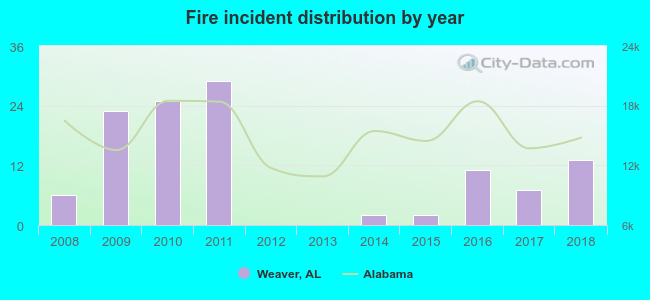 According to the data from the years 2008 - 2018 the average number of fires per year is 11. The highest number of fires - 29 took place in 2011, and the least - 0 in 2012. The data has a rising trend.
 41.5% incidents where reported in the morning and 58.5% in the evening. The most fires (16.9%) took place on Wednesday, and the least (11.9%) on Saturday.
 Based on the 118 fire incidents from years 2008 - 2018 most fires (15.3%) took place during February, and the least (3.4%) in December.
 Out of all 164 cases reported during the years 2008 - 2018, the most belonged to the categories: Fire (72.0%), Service Call (10.4%), and Rescue & EMS (7.9%).
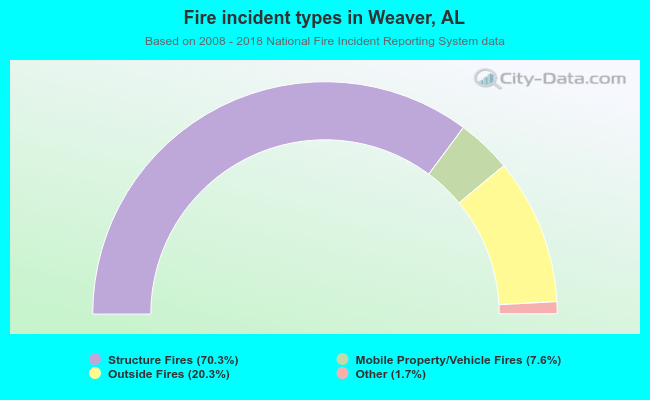 When looking into fire subcategories, the most incidents belonged to: Structure Fires (70.3%), and Outside Fires (20.3%).