Webster: Fire Incidents, Massachusetts (MA)
Where are fire incidents reported in Webster, MA
Something went wrong! Please refresh the page.
| Fire incidents reported | |
|---|---|
| Sreet name | Count |
| MAIN ST | 80 |
| SCHOOL ST | 68 |
| THOMPSON RD | 60 |
| EAST MAIN ST | 48 |
| GRANITE ST | 44 |
| E MAIN ST | 42 |
| SLATER ST | 42 |
| VILLAGE WAY | 34 |
| LOWER GORE RD | 30 |
| WORCESTER RD | 30 |
| LAKE ST | 28 |
| MYRTLE AVE | 28 |
| WHITCOMB ST | 28 |
| GORE RD | 26 |
| HARTLEY ST | 26 |
| PEARL ST | 24 |
| NEGUS ST | 22 |
| PROSPECT ST | 22 |
| CUDWORTH RD | 20 |
| GODDARD ST | 20 |
| LINCOLN ST | 20 |
| NORTH MAIN ST | 20 |
| SUTTON RD | 20 |
| UPPER GORE RD | 20 |
| N MAIN ST | 18 |
| FIFTH AVE | 16 |
| HIGH ST | 16 |
| LAKESIDE AVE | 16 |
| POLAND ST | 16 |
| GOLDEN HEIGHTS | 14 |
| Other | 88 |
2002 - 2018 National Fire Incident Reporting System (NFIRS) incidents
- Incident types reported to NFIRS in Webster, MA
- 1,82230.1%Hazardous Condition
- 1,42223.5%False Alarm
- 98616.3%Fire
- 83813.9%Service Call
- 4948.2%Rescue & EMS
- 4277.1%Good Intent Call
- 340.6%Special Incident
- 130.2%Severe Weather
- 110.2%Overpressure Rupture
- Fire incident types reported to NFIRS in Webster, MA
- 49550.2%Structure Fires
- 27928.3%Outside Fires
- 12612.8%Mobile Property/Vehicle Fires
- 868.7%Other
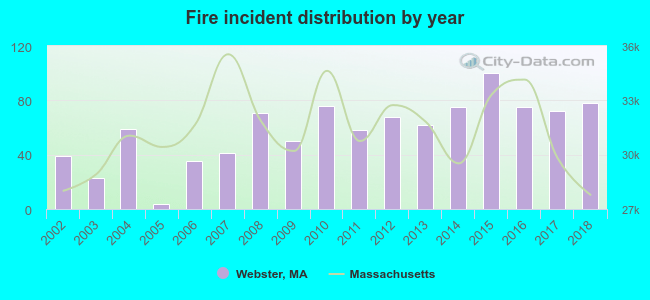 According to the data from the years 2002 - 2018 the average number of fire incidents per year is 58. The highest number of reported fire incidents - 100 took place in 2015, and the least - 4 in 2005. The data has a rising trend.
The average number of yearly fire incidents per 10k residents in Webster, MA compared to nearest cities:
(Note: Based on data for the last 3 years, including only cities with population 5,000 and above)
| Webster: | 65.7 |
| Dudley: | 36.3 |
| Oxford: | 162.8 |
| Douglas: | 33.4 |
| Charlton: | 51.9 |
| Southbridge: | 40.9 |
| Sutton: | 44.3 |
| Auburn: | 39.3 |
| Whitinsville: | 3.0 |
 The median response time based on all reported fire incidents is 8 minutes. This is higher compared to the state median value.
The median response time in Webster, MA compared to nearest cities:
(Note: Based on data for all years, including only cities with at least 500 fire incidents)
| Webster: | 8 minutes |
| Dudley: | 9 minutes |
| Oxford: | 8 minutes |
| Douglas: | 8 minutes |
| Charlton: | 8 minutes |
| Southbridge: | 4 minutes |
| Sutton: | 8 minutes |
| Putnam: | 6 minutes |
| Sturbridge: | 9 minutes |
 According to the reports from the years 2002 - 2018 the average number of fire-related fatalities per year is 0. The highest number of reported deaths - 1 took place in 2005, and the lowest - 0 in 2002. The data has a constant trend.
 Based on the reports from the years 2002 - 2018 the average number of fire-related yearly casualties is 1. The highest number of reported casualties - 4 took place in 2015, and the lowest - 0 in 2002. The data has a rising trend.
The average number of injuries per 1,000 fire incidents is 7. This indicator was the highest - 40 in 2015, and the lowest 0 in 2002. The trend for casualties per 1,000 fires is rising. Compared to the state value the number of casualties per 1,000 incidents is about the same.
Based on the reports from the years 2002 - 2018 the average number of fire-related yearly casualties is 1. The highest number of reported casualties - 4 took place in 2015, and the lowest - 0 in 2002. The data has a rising trend.
The average number of injuries per 1,000 fire incidents is 7. This indicator was the highest - 40 in 2015, and the lowest 0 in 2002. The trend for casualties per 1,000 fires is rising. Compared to the state value the number of casualties per 1,000 incidents is about the same.Casualties per 1,000 incidents in Webster, MA compared to nearest cities:
(Note: Based on data for all years, including only cities with at least 500 fire incidents)
| Webster: | 9.1 |
| Dudley: | 21.4 |
| Oxford: | 26.0 |
| Douglas: | 7.6 |
| Charlton: | 12.7 |
| Southbridge: | 33.5 |
| Sutton: | 0.0 |
| Putnam: | 5.3 |
| Sturbridge: | 12.0 |
 31.2% incidents where reported in the morning and 68.8% in the evening. The most fires (16.5%) took place on Thursday, and the least (12.1%) on Wednesday.
 Based on the 986 incident reports from years 2002 - 2018 most fires (12.1%) took place during April, and the least (4.8%) in August.
 Out of all 6,047 cases reported during the years 2002 - 2018, the most belonged to the categories: Hazardous Condition (30.1%), False Alarm (23.5%), and Fire (16.3%).
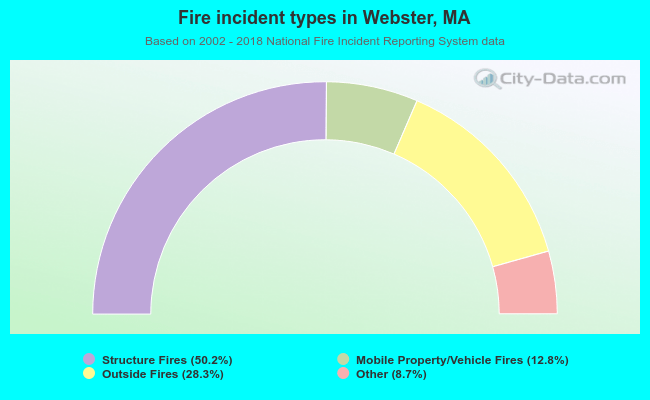 When looking into fire subcategories, the most reports belonged to: Structure Fires (50.2%), and Outside Fires (28.3%).