Weir: Fire Incidents, Kansas (KS)
Where are fire incidents reported in Weir, KS
Something went wrong! Please refresh the page.
|
| |||||||||||||||||||||||||||||||||||||||||||||||||||||||||||||||||||||||||||||||||||||||||||||||||||||||||||||
| Other | 5 | |||||||||||||||||||||||||||||||||||||||||||||||||||||||||||||||||||||||||||||||||||||||||||||||||||||||||||||
2002 - 2018 National Fire Incident Reporting System (NFIRS) incidents
- Incident types reported to NFIRS in Weir, KS
- 48960.7%Fire
- 14518.0%Rescue & EMS
- 8410.4%Good Intent Call
- 374.6%Hazardous Condition
- 283.5%Service Call
- 121.5%False Alarm
- 81.0%Severe Weather
- 20.2%Special Incident
- Fire incident types reported to NFIRS in Weir, KS
- 31263.8%Outside Fires
- 13126.8%Structure Fires
- 275.5%Mobile Property/Vehicle Fires
- 193.9%Other
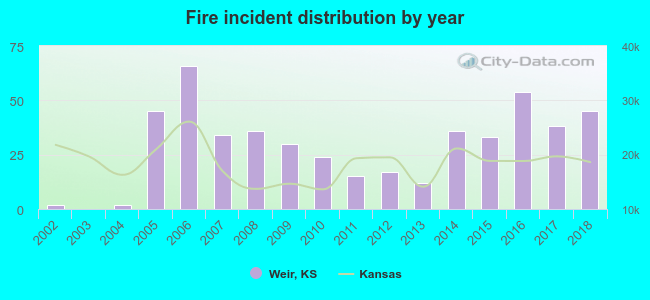 According to the data from the years 2002 - 2018 the average number of fires per year is 29. The highest number of reported fires - 66 took place in 2006, and the least - 0 in 2003. The data has an increasing trend.
 23.3% incidents where reported in the morning and 76.7% in the evening. The most fires (22.3%) took place on Saturday, and the least (10.4%) on Friday.
 Based on the 489 fire incidents from years 2002 - 2018 most fires (19.2%) took place during March, and the least (3.5%) in September.
 Out of all 805 cases reported during the years 2002 - 2018, the most belonged to the categories: Fire (60.7%), Overpressure Rupture (18.0%), and Service Call (10.4%).
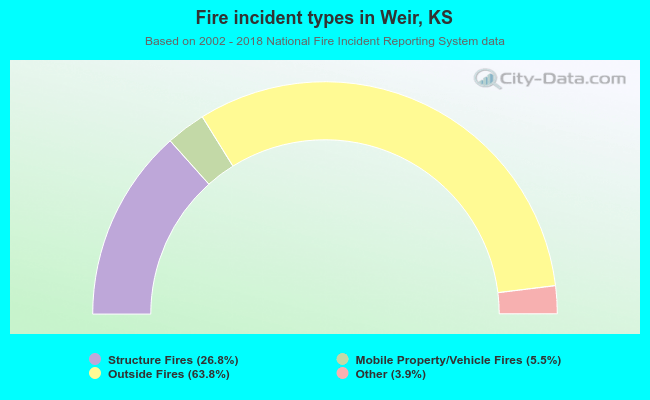 When looking into fire subcategories, the most reports belonged to: Outside Fires (63.8%), and Structure Fires (26.8%).