| Fire incidents reported |
|---|
| Sreet name | Count |
|---|
| WELLINGTON | 16 | | 3450 EAST HWY 6 | 10 | | MAIN STREET | 10 | | 2195 EAST MAIN | 8 | | 1860 W RIDGE ROAD | 6 | | 100 NORTH | 4 | | 1840 W RIDGE ROAD | 4 | | 400 WEST | 4 | | COAL CREEK RD | 4 | | MAIN | 4 | | 100 E. 100 N. | 2 | | 100 EAST & RIDGE ROAD | 2 | | 1000 EAST RIDGEROAD | 2 | | 1010 E MAIN | 2 | | 1010 EAST MAIN | 2 | | 104 S 250 W | 2 | | 106 W 250 S #106A | 2 | | 1150 E MAIN | 2 | | 1222 E MAIN | 2 | | 1275 WEST RIDGE ROAD | 2 | | 1288 E MAIN | 2 | | 1500 E NORTH COAL CREEK RD | 2 | | 1500 EAST | 2 | | 1500 EAST COAL CREEK RD | 2 | | 1511 SOUTH 2350 EAST | 2 |
| | | Fire incidents reported |
|---|
| Sreet name | Count |
|---|
| 1600 W 750 S | 2 | | 1775 WEST 750 SOUTH | 2 | | 1801 E RIDGE RD | 2 | | 1840 WEST RIDGE ROAD | 2 | | 185 EAST 950 NORTH | 2 | | 1860 WEST RIDGE ROAD | 2 | | 1865 W RIDGE RD | 2 | | 1885 E MAIN | 2 | | 195 S 600 E | 2 | | 20 EAST 100 NORTH | 2 | | 200 | 2 | | 200 E RR | 2 | | 2005 E 5000 S | 2 | | 2010 E 100 N | 2 | | 2020 E. 5000 S. | 2 | | 2025 E 5000 S | 2 | | 2195 E MAIN | 2 | | 2195 EAST HWY 6 | 2 | | 2320 E MAIN | 2 | | 2384 E COAL CREEK RD | 2 | | 2389 E. COAL CREEK RD | 2 | | 2389 S EAST COAL CREEK RD | 2 | | 240 N CENTER STREET | 2 | | 240 W MAIN | 2 | | |
|
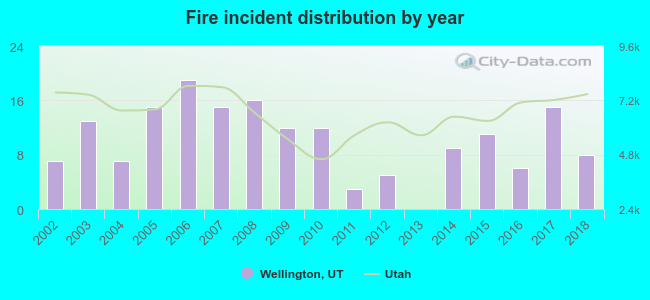 According to the data from the years 2002 - 2018 the average number of fire incidents per year is 10. The highest number of reported fire incidents - 19 took place in 2006, and the least - 0 in 2013. The data has a rising trend.
 31.8% incidents where reported in the morning and 68.2% in the evening. The most fires (18.5%) took place on Monday, and the least (11.0%) on Thursday.
 According to the 173 fire incidents from years 2002 - 2018 most fires (18.5%) took place during July, and the least (4.0%) in August.
 Out of all 733 cases reported during the years 2002 - 2018, the most belonged to the categories: Overpressure Rupture (62.2%), Fire (23.6%), and Rescue & EMS (7.0%).
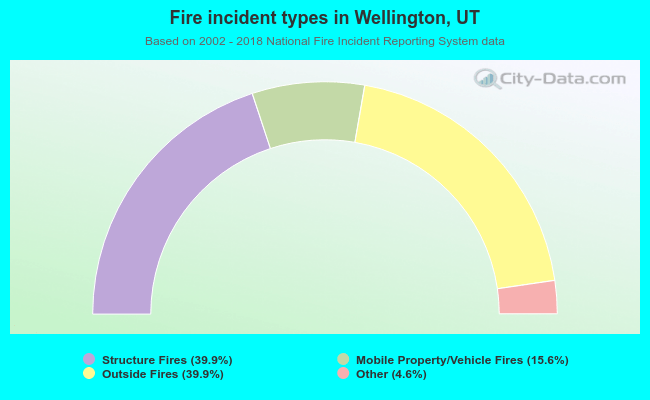 When looking into fire subcategories, the most reports belonged to: Structure Fires (39.9%), and Outside Fires (39.9%).