Wellsburg: Fire Incidents, New York (NY)
Where are fire incidents reported in Wellsburg, NY
Something went wrong! Please refresh the page.
|
| |||||||||||||||||||||||||||||||||||||||||||||||||||||||||||||||||||||||||||||||||||||||||||||
2003 - 2018 National Fire Incident Reporting System (NFIRS) incidents
- Incident types reported to NFIRS in Wellsburg, NY
- 50655.0%Rescue & EMS
- 11512.5%Good Intent Call
- 10411.3%Fire
- 879.5%Hazardous Condition
- 788.5%Service Call
- 192.1%False Alarm
- 101.1%Severe Weather
- 10.1%Special Incident
- Fire incident types reported to NFIRS in Wellsburg, NY
- 4442.3%Structure Fires
- 3028.8%Outside Fires
- 2726.0%Mobile Property/Vehicle Fires
- 32.9%Other
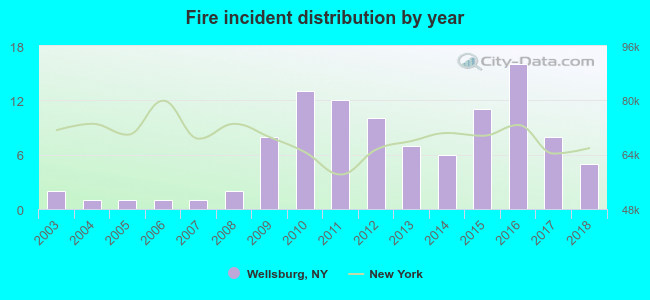 Based on the data from the years 2003 - 2018 the average number of fire incidents per year is 7. The highest number of reported fire incidents - 16 took place in 2016, and the least - 1 in 2004. The data has a rising trend.
 37.5% incidents where reported in the morning and 62.5% in the evening. The most fires (22.1%) took place on Wednesday, and the least (5.8%) on Tuesday.
 According to the 104 reports from years 2003 - 2018 most fires (15.4%) took place during April, and the least (3.8%) in May.
 Out of all 920 cases reported during the years 2003 - 2018, the most belonged to the categories: Overpressure Rupture (55.0%), Service Call (12.5%), and Fire (11.3%).
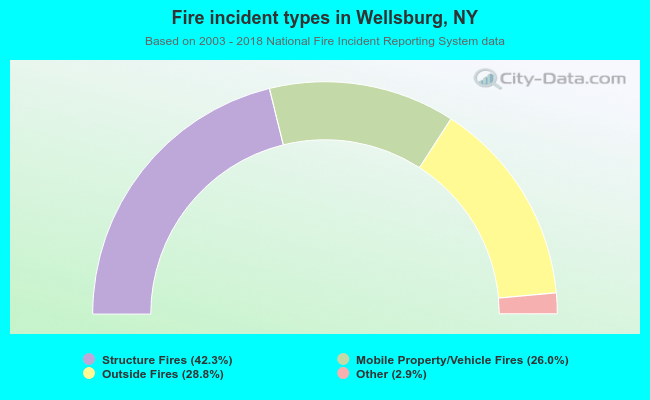 When looking into fire subcategories, the most incidents belonged to: Structure Fires (42.3%), and Outside Fires (28.8%).