Wellston: Fire Incidents, Ohio (OH)
Where are fire incidents reported in Wellston, OH
Something went wrong! Please refresh the page.
| Fire incidents reported | |
|---|---|
| Sreet name | Count |
| PENNSYLVANIA AVE | 174 |
| MULGA RD | 86 |
| MICHIGAN AVE | 78 |
| 2ND ST | 68 |
| ILLINOIS AVE | 64 |
| OHIO AVE | 64 |
| 10TH ST | 48 |
| 13TH ST | 46 |
| BROADWAY ST | 44 |
| NEW YORK AVE | 44 |
| ST RT 93 | 44 |
| WISCONSIN AVE | 44 |
| HARDSCRAPPLE RD | 40 |
| 327 | 38 |
| FINLEY CHAPEL RD | 38 |
| KISOR RD | 32 |
| MINNESOTA AVE | 30 |
| 1ST ST | 28 |
| B ST | 28 |
| JACKMAN RD | 28 |
| STATE ROUTE 327 | 28 |
| MASSACHUSETTS AVE | 26 |
| RHODE ISLAND AVE | 26 |
| 12TH ST | 24 |
| SECOND ST | 24 |
| STATE ROUTE 124 | 24 |
| 327 RT | 22 |
| CONNECTICUT AVE | 22 |
| GRADY LN | 22 |
| HIRAM WEST RD | 22 |
| Other | 286 |
2002 - 2018 National Fire Incident Reporting System (NFIRS) incidents
- Incident types reported to NFIRS in Wellston, OH
- 1,59239.2%Fire
- 1,01625.0%Rescue & EMS
- 84920.9%Hazardous Condition
- 2185.4%Service Call
- 2035.0%Good Intent Call
- 1593.9%False Alarm
- 110.3%Overpressure Rupture
- 50.1%Severe Weather
- Fire incident types reported to NFIRS in Wellston, OH
- 83252.3%Structure Fires
- 53533.6%Outside Fires
- 22314.0%Mobile Property/Vehicle Fires
- 20.1%Other
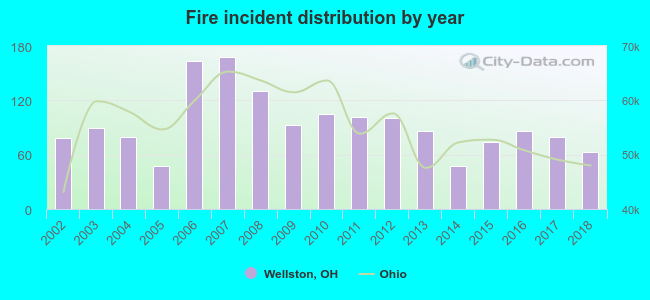 According to the data from the years 2002 - 2018 the average number of fires per year is 94. The highest number of fires - 168 took place in 2007, and the least - 47 in 2005. The data has a declining trend.
The average number of yearly fire incidents per 10k residents in Wellston, OH compared to nearest cities:
(Note: Based on data for the last 3 years, including only cities with population 5,000 and above)
| Wellston: | 137.3 |
| Jackson: | 157.0 |
| Athens: | 45.9 |
| Chillicothe: | 128.5 |
| Nelsonville: | 95.3 |
| Logan: | 104.8 |
| Wheelersburg: | 76.1 |
| Portsmouth: | 82.0 |
 The median response time based on all reported fire incidents is 7 minutes. This is comparable to the state median value.
The median response time in Wellston, OH compared to nearest cities:
(Note: Based on data for all years, including only cities with at least 500 fire incidents)
| Wellston: | 7 minutes |
| Jackson: | 10 minutes |
| McArthur: | 11 minutes |
| Oak Hill: | 11 minutes |
| Beaver: | 15 minutes |
| South Webster: | 11 minutes |
| Minford: | 11 minutes |
| Piketon: | 16 minutes |
| Laurelville: | 11 minutes |
 Based on the reports from the years 2002 - 2018 the average number of fire-related fatalities per year is 0. The highest number of deaths - 2 took place in 2002, and the lowest - 0 in 2003. The data has a dropping trend.
 According to the reports from the years 2002 - 2018 the average number of fire-related yearly casualties is 2. The highest number of injuries - 5 took place in 2017, and the lowest - 0 in 2007. The data has a dropping trend.
The average number of injuries per 1,000 fire incidents is 24. This indicator was the highest - 63 in 2017, and the lowest 0 in 2007. The trend for casualties per 1,000 fires is decreasing. Compared to the state value the number of injuries per 1,000 fires is higher.
According to the reports from the years 2002 - 2018 the average number of fire-related yearly casualties is 2. The highest number of injuries - 5 took place in 2017, and the lowest - 0 in 2007. The data has a dropping trend.
The average number of injuries per 1,000 fire incidents is 24. This indicator was the highest - 63 in 2017, and the lowest 0 in 2007. The trend for casualties per 1,000 fires is decreasing. Compared to the state value the number of injuries per 1,000 fires is higher.Casualties per 1,000 incidents in Wellston, OH compared to nearest cities:
(Note: Based on data for all years, including only cities with at least 500 fire incidents)
| Wellston: | 21.4 |
| Jackson: | 16.2 |
| McArthur: | 5.0 |
| Oak Hill: | 7.6 |
| Beaver: | 1.4 |
| South Webster: | 0.0 |
| Minford: | 0.0 |
| Piketon: | 3.7 |
| Laurelville: | 0.0 |
 36.9% incidents where reported in the morning and 63.1% in the evening. The most fires (17.7%) took place on Saturday, and the least (12.4%) on Sunday.
 Based on the 1,592 reports from years 2002 - 2018 most fires (11.6%) took place during April, and the least (5.8%) in September.
 Out of all 4,057 cases reported during the years 2002 - 2018, the most belonged to the categories: Fire (39.2%), Rescue & EMS (25.0%), and Hazardous Condition (20.9%).
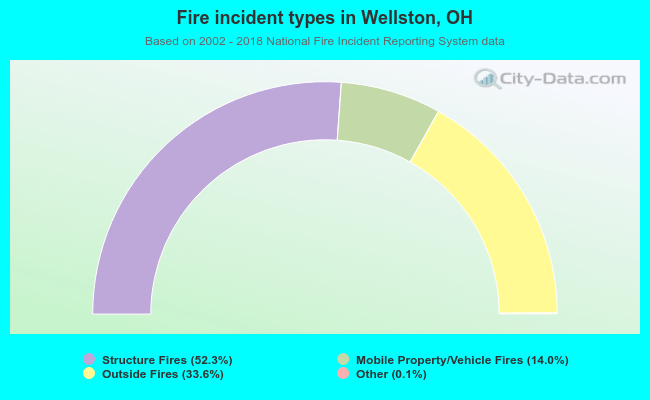 When looking into fire subcategories, the most reports belonged to: Structure Fires (52.3%), and Outside Fires (33.6%).