| Fire incidents reported |
|---|
| Sreet name | Count |
|---|
| MAIN ST | 34 | | STATE ROUTE 19 | 24 | | STATE ROUTE 417 | 18 | | MADISON HILL RD | 16 | | BROOKLYN AVE | 12 | | EAST STATE STREET | 12 | | GRAVES RD | 12 | | MAIN STREET | 12 | | STATE ROUTE 19 RD | 12 | | STATE ROUTE 417 RD | 10 | | MESERVEY HILL RD | 8 | | NILES HILL RD | 8 | | SCHRADER RD | 8 | | STATE RTE 417 W | 8 | | BROAD STREET | 6 | | BROWN RD | 6 | | COATS ST | 6 | | FASSETT LA | 6 | | KING STREET | 6 | | LAGOON RECREATION AREA | 6 | | MADISON ST | 6 | | MADISON STREET | 6 | | NORTH MAIN STREET | 6 | | PALMER ROAD | 6 | | PROCTOR RD | 6 |
| | | Fire incidents reported |
|---|
| Sreet name | Count |
|---|
| SCOTT AVE | 6 | | SMITH HOLLOW RD | 6 | | SOUTH HILL RD | 6 | | STATE RT 417 | 6 | | STATE ST | 6 | | STEVENS STREET | 6 | | TRAPPING BROOK RD | 6 | | TRUAX RD | 6 | | ALMA FIRE DEPT | 4 | | BOLIVAR ROAD RD | 4 | | CAMERON STREET | 4 | | COUNTY ROAD 30 | 4 | | COUNTY ROAD 44 | 4 | | DYKE ST | 4 | | EAST DYKE STREET | 4 | | FASSETT ST | 4 | | HANOVER ST | 4 | | ISLAND PARK | 4 | | KETCHNER RD | 4 | | KETCHNER RD | 4 | | MADDISON HILL RD | 4 | | MADISON HILL RD | 4 | | MARTIN STREET | 4 | | MERRIAM HTS | 4 | | NORTH BROAD STREET | 4 |
|
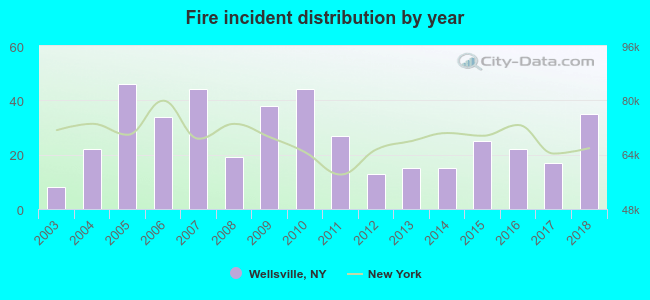 Based on the data from the years 2003 - 2018 the average number of fire incidents per year is 27. The highest number of reported fire incidents - 46 took place in 2005, and the least - 8 in 2003. The data has a rising trend.
 32.1% incidents where reported in the morning and 67.9% in the evening. The most fires (16.3%) took place on Friday, and the least (12.0%) on Saturday.
 According to the 424 reports from years 2003 - 2018 most fires (17.5%) took place during April, and the least (5.9%) in February.
 Out of all 1,605 cases reported during the years 2003 - 2018, the most belonged to the categories: Hazardous Condition (31.9%), Fire (26.4%), and False Alarm (17.6%).
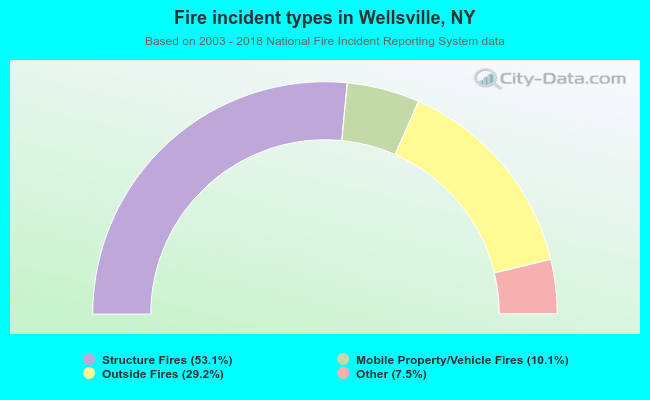 When looking into fire subcategories, the most incidents belonged to: Structure Fires (53.1%), and Outside Fires (29.2%).