| Fire incidents reported |
|---|
| Sreet name | Count |
|---|
| COMMUNITY ST | 32 | | LISBURN RD | 24 | | KRALLTOWN RD | 20 | | OLD YORK RD | 18 | | ROSSTOWN RD | 18 | | PINETOWN RD | 14 | | SPRING VALLEY RD | 14 | | CARLISLE RD | 12 | | BULL RD | 10 | | MINE BANK RD | 10 | | QUARRY RD | 10 | | ALPINE RD | 8 | | BENTZ MILL RD | 8 | | HARMONY GROVE RD | 8 | | THUNDERGUST MILL RD | 8 | | WELLSVILLE RD | 8 | | ZEIGLER RD | 8 | | BENTZ MILL ROAD | 6 | | DETTERS MILL RD | 6 | | MAIN ST | 6 | | MOUNT TOP RD | 6 | | MT AIRY RD | 6 | | YORK RD | 6 | | YORK ST | 6 | | ZIEGLER RD | 6 |
| | | Fire incidents reported |
|---|
| Sreet name | Count |
|---|
| BENTZ MILL RD | 4 | | BUTTER CUP | 4 | | KRALLTOWN RD | 4 | | LIZBURN RD. | 4 | | MT ZION RD | 4 | | PEIFER RD | 4 | | PINE TOWN RD | 4 | | PINE WOODS RD | 4 | | WELLSVILLE RD | 4 | | ZEIGLERS CHURCH RD | 4 | | 352 NORTH MAIN ST | 2 | | AAA OUT OF TOWNSHIP | 2 | | BENTZMILL RD | 2 | | BIG ROCK DR | 2 | | BIG ROCK DR | 2 | | BIG ROCK DRIVE | 2 | | CABIN HOLLOW RD | 2 | | CARLISLE ROAD | 2 | | CARROLL ST | 2 | | CEDAR CREEK RD | 2 | | COMMUNITRY ST | 2 | | COMMUNITY STREET | 2 | | DEARDORFF RD | 2 | | DETTERS MILL RD | 2 | | |
|
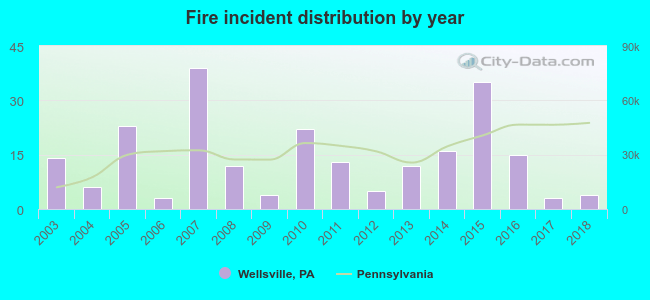 According to the data from the years 2003 - 2018 the average number of fires per year is 14. The highest number of fire incidents - 39 took place in 2007, and the least - 3 in 2006. The data has a declining trend.
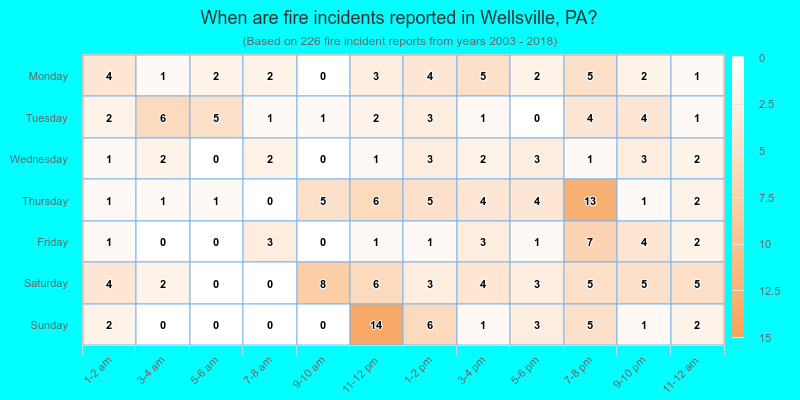
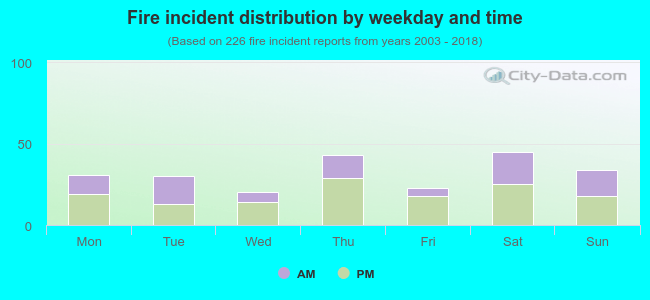 39.8% incidents where reported in the morning and 60.2% in the evening. The most fires (19.9%) took place on Saturday, and the least (8.8%) on Wednesday.
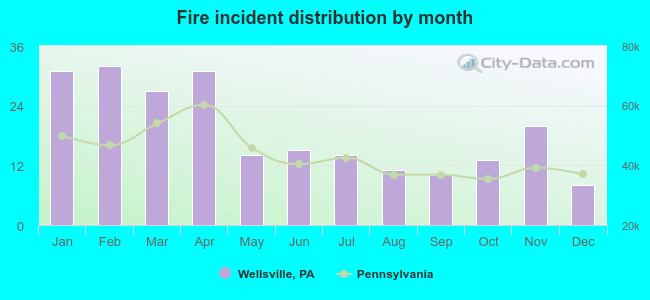 Based on the 226 fires from years 2003 - 2018 most fires (14.2%) took place during February, and the least (3.5%) in December.
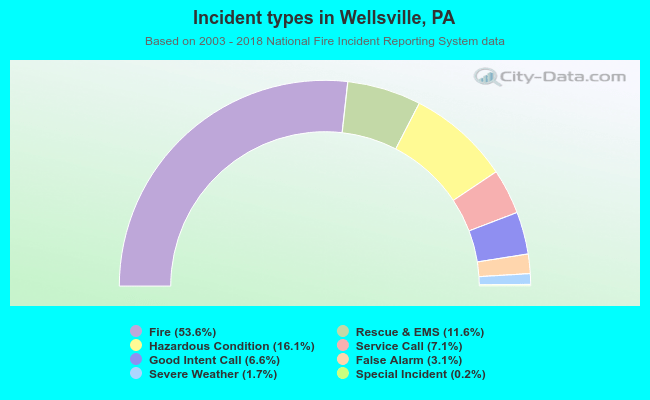 Out of all 422 cases reported during the years 2003 - 2018, the most belonged to the categories: Fire (53.6%), Rescue & EMS (16.1%), and Overpressure Rupture (11.6%).
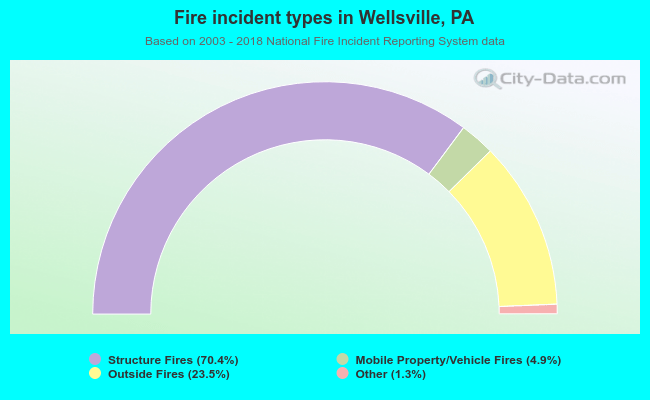 When looking into fire subcategories, the most incidents belonged to: Structure Fires (70.4%), and Outside Fires (23.5%).