Wendover: Fire Incidents, Utah (UT)
Where are fire incidents reported in Wendover, UT
Something went wrong! Please refresh the page.
|
| |||||||||||||||||||||||||||||||||||||||||||||||||||||||||||||||||||||||||||||||||||||||||||||||||||||||||||||
2002 - 2018 National Fire Incident Reporting System (NFIRS) incidents
- Incident types reported to NFIRS in Wendover, UT
- 90659.1%Hazardous Condition
- 31020.2%Rescue & EMS
- 16110.5%Fire
- 734.8%Service Call
- 473.1%Good Intent Call
- 251.6%Special Incident
- 120.8%False Alarm
- Fire incident types reported to NFIRS in Wendover, UT
- 6641.0%Outside Fires
- 4628.6%Mobile Property/Vehicle Fires
- 3723.0%Structure Fires
- 127.5%Other
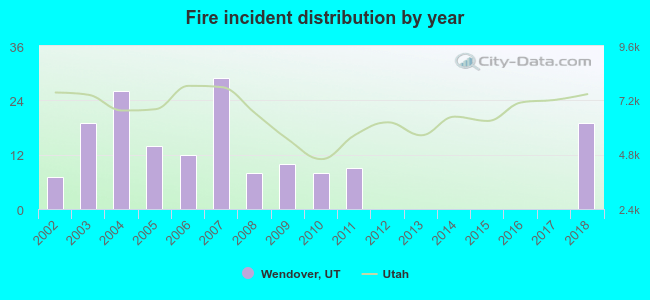 According to the data from the years 2002 - 2018 the average number of fire incidents per year is 9. The highest number of reported fire incidents - 29 took place in 2007, and the least - 0 in 2012. The data has a rising trend.
 38.5% incidents where reported in the morning and 61.5% in the evening. The most fires (17.4%) took place on Saturday, and the least (11.2%) on Tuesday.
 According to the 161 fire incidents from years 2002 - 2018 most fires (14.9%) took place during June, and the least (5.6%) in February.
 Out of all 1,534 cases reported during the years 2002 - 2018, the most belonged to the categories: Rescue & EMS (59.1%), Overpressure Rupture (20.2%), and Fire (10.5%).
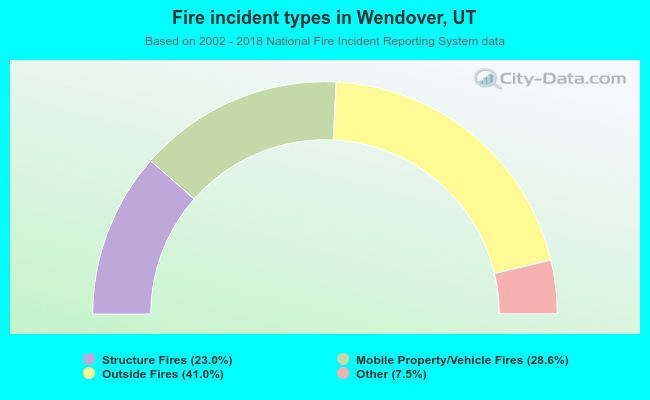 When looking into fire subcategories, the most reports belonged to: Outside Fires (41.0%), and Mobile Property/Vehicle Fires (28.6%).