Wernersville: Fire Incidents, Pennsylvania (PA)
Where are fire incidents reported in Wernersville, PA
Something went wrong! Please refresh the page.
|
| |||||||||||||||||||||||||||||||||||||||||||||||||||||||||||||||||||||||||||||||||||||||||||||||||||||||||||||
2004 - 2018 National Fire Incident Reporting System (NFIRS) incidents
- Incident types reported to NFIRS in Wernersville, PA
- 48940.5%Fire
- 23519.5%Hazardous Condition
- 18815.6%False Alarm
- 15813.1%Good Intent Call
- 605.0%Service Call
- 443.6%Rescue & EMS
- 221.8%Special Incident
- 110.9%Severe Weather
- Fire incident types reported to NFIRS in Wernersville, PA
- 31464.2%Structure Fires
- 8517.4%Other
- 7014.3%Outside Fires
- 204.1%Mobile Property/Vehicle Fires
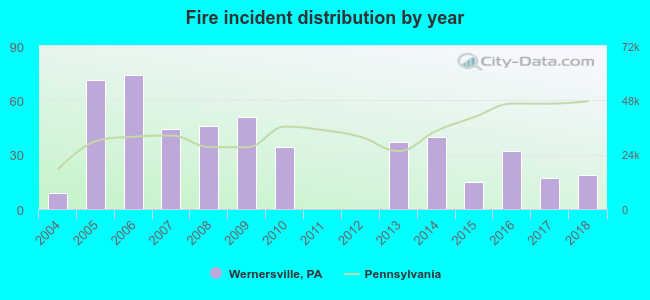 According to the data from the years 2004 - 2018 the average number of fires per year is 33. The highest number of fire incidents - 74 took place in 2006, and the least - 0 in 2011. The data has a rising trend.
 35.6% incidents where reported in the morning and 64.4% in the evening. The most fires (17.8%) took place on Monday, and the least (11.0%) on Friday.
 Based on the 489 fires from years 2004 - 2018 most fires (13.1%) took place during February, and the least (4.3%) in September.
 Out of all 1,208 cases reported during the years 2004 - 2018, the most belonged to the categories: Fire (40.5%), Hazardous Condition (19.5%), and False Alarm (15.6%).
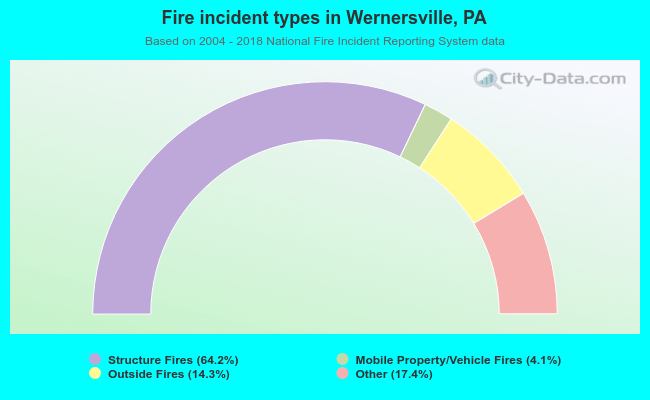 When looking into fire subcategories, the most incidents belonged to: Structure Fires (64.2%), and Other (17.4%).