| Fire incidents reported |
|---|
| Sreet name | Count |
|---|
| SHAW RD | 40 | | BUTLER HILL RD | 18 | | 2521 SHAW RD | 12 | | MILLER RD | 10 | | CARNAHAN RD | 8 | | SECOND ST | 8 | | SHADY OAKS RD | 8 | | JOHNSON ST | 6 | | US RT 30 | 6 | | 2ND ST | 4 | | BROOKLYN RD | 4 | | MERIDIAN RD | 4 | | SHAW RD | 4 | | TOWER RD | 4 | | U.S ROUTE 30 | 4 | | US ROUTE 30 | 4 | | 1025 MILLER RD | 2 | | 1064 MELUGINS GROVE RD | 2 | | 1126 BROOKLYN RD | 2 | | 1141 TOWN HALL RD | 2 | | 1ST ST ST | 2 | | 1ST STRE | 2 | | 2250 WEST BROOKLYN RD | 2 | | 2317 WEST BROOKLYN RD | 2 | | 2329 U.S. ROUTE 30 | 2 |
| | | Fire incidents reported |
|---|
| Sreet name | Count |
|---|
| 2329 US RT 30 | 2 | | 2364 IL RT 30 | 2 | | 2396 BUTLER HILL RD | 2 | | 2440 SHAW RD | 2 | | 2526 BUTLER HILL RD | 2 | | 2529 SHAW RD | 2 | | 2531 JOHNSON | 2 | | 2531 JOHNSON ST | 2 | | 2539 SHAW RD | 2 | | 2561 SHADY OAKES RD | 2 | | 2598 TOWER RD | 2 | | 2600 SPUR ROAD | 2 | | 2ND ST | 2 | | 2ND STREET | 2 | | 377 CARNAHAN RD | 2 | | 3RD AND WATER ST | 2 | | 3RD STREET | 2 | | 425 BROOKLYN RD | 2 | | 528 WEST BROOKLYN RD | 2 | | 569 WEST BROOKLYN RD | 2 | | 760 1ST ST | 2 | | 760FIRST | 2 | | 903 BROOKLYN ROAD RD | 2 | | 904 BROOKLYN RD | 2 | | |
|
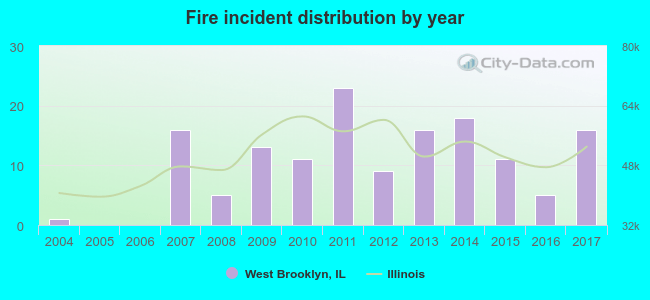 According to the data from the years 2004 - 2017 the average number of fires per year is 10. The highest number of reported fires - 23 took place in 2011, and the least - 0 in 2005. The data has an increasing trend.
 29.9% incidents where reported in the morning and 70.1% in the evening. The most fires (22.9%) took place on Wednesday, and the least (4.2%) on Thursday.
 According to the 144 incident reports from years 2004 - 2017 most fires (23.6%) took place during March, and the least (2.1%) in July.
 Out of all 284 cases reported during the years 2004 - 2017, the most belonged to the categories: Fire (50.7%), Overpressure Rupture (40.5%), and Service Call (4.2%).
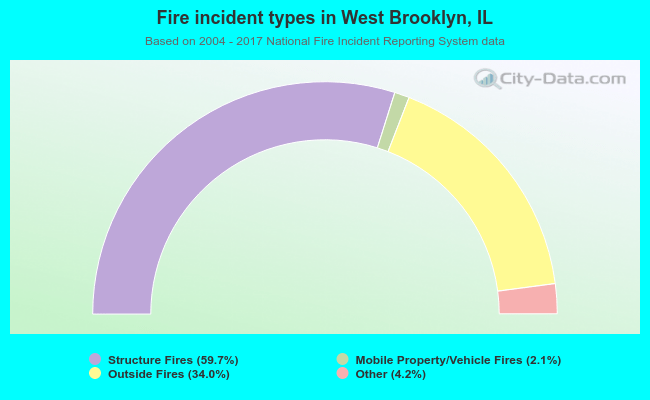 When looking into fire subcategories, the most incidents belonged to: Structure Fires (59.7%), and Outside Fires (34.0%).