West Fork: Fire Incidents, Arkansas (AR)
Where are fire incidents reported in West Fork, AR
Something went wrong! Please refresh the page.
|
| |||||||||||||||||||||||||||||||||||||||||||||||||||||||||||||||||||||||||||||||||||||||||||||||||||||||||||||
| Other | 1 | |||||||||||||||||||||||||||||||||||||||||||||||||||||||||||||||||||||||||||||||||||||||||||||||||||||||||||||
2002 - 2018 National Fire Incident Reporting System (NFIRS) incidents
- Incident types reported to NFIRS in West Fork, AR
- 1,81173.5%Rescue & EMS
- 37715.3%Fire
- 1546.3%Good Intent Call
- 441.8%Service Call
- 431.7%Hazardous Condition
- 271.1%False Alarm
- 40.2%Special Incident
- Fire incident types reported to NFIRS in West Fork, AR
- 19551.7%Outside Fires
- 11129.4%Structure Fires
- 379.8%Mobile Property/Vehicle Fires
- 349.0%Other
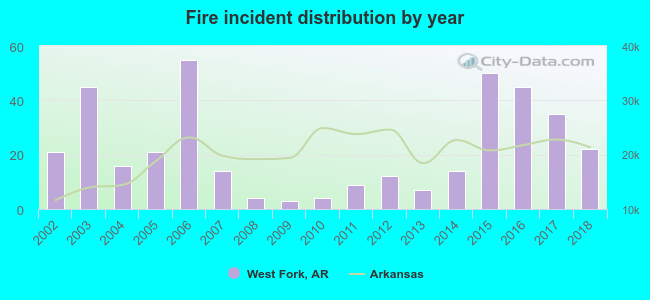 According to the data from the years 2002 - 2018 the average number of fires per year is 22. The highest number of reported fire incidents - 55 took place in 2006, and the least - 3 in 2009. The data has a growing trend.
 26.3% incidents where reported in the morning and 73.7% in the evening. The most fires (17.5%) took place on Thursday, and the least (10.9%) on Tuesday.
 Based on the 377 fire incidents from years 2002 - 2018 most fires (16.7%) took place during January, and the least (4.2%) in May.
 Out of all 2,463 cases reported during the years 2002 - 2018, the most belonged to the categories: Rescue & EMS (73.5%), Fire (15.3%), and Good Intent Call (6.3%).
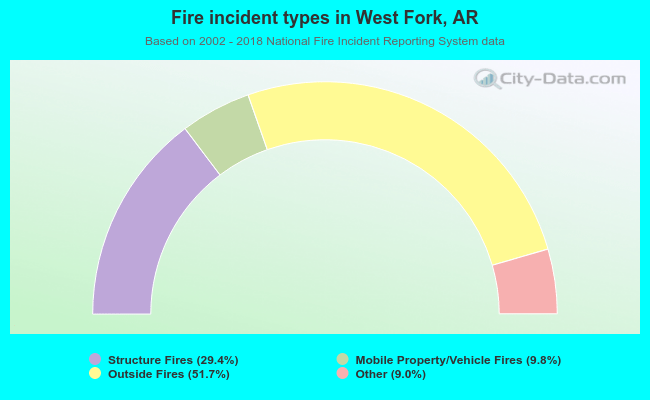 When looking into fire subcategories, the most reports belonged to: Outside Fires (51.7%), and Structure Fires (29.4%).