| Fire incidents reported |
|---|
| Sreet name | Count |
|---|
| 400 LOCUST ST | 14 | | HWY 163 | 12 | | NC HWY 163 | 12 | | MT JEFFERSON RD | 10 | | IDLEWILD RD | 8 | | 230 HICE AVE | 6 | | DOGGET RD | 6 | | HICE AVE | 6 | | OLD OBIDS RD | 6 | | 1056 HWY 194 NORTH | 4 | | 132 LAURELWOOD DR. | 4 | | 1489 MT JEFFERSON RD | 4 | | 1755 MT JEFFERSON RD | 4 | | 2830 NETTLE KNOB RD | 4 | | 440 SADDLE GAP RD | 4 | | 505 BARE ST | 4 | | 505 N JEFFERSON AVE | 4 | | 601 SOUTH JEFFERSON AVE | 4 | | BALD MTN RD | 4 | | BARE RD | 4 | | BOGGS RD | 4 | | CALLOWAY GAP RD | 4 | | CAMPUS DRIVE | 4 | | CANON LANE | 4 | | CANON LN | 4 |
| | | Fire incidents reported |
|---|
| Sreet name | Count |
|---|
| DANIELS DREAM DR | 4 | | DICK PHILLIPS RD | 4 | | EAST FOURTH ST | 4 | | FRANK DILLARD RD | 4 | | FRANK DILLARD RD | 4 | | HWY 194 | 4 | | JARVIS RD | 4 | | MAIN ST | 4 | | NC HWY 16 SOUTH | 4 | | NC HWY 163 S | 4 | | NIKANOR RD | 4 | | OLD OBIDS RD | 4 | | RHODODENDRON RUN RD | 4 | | SECOND STREET | 4 | | SOUTH JEFFERSON AV | 4 | | US HWY 221 | 4 | | WYATT LN | 4 | | 100 DAVIS ACRES | 2 | | 1016 DOGGET RD. | 2 | | 103 BURKETT AVE | 2 | | 103 FRANK EDWARDS RD | 2 | | 103 SOUTH JEFFERSON AVE | 2 | | 1043 EAST 8TH STREET | 2 | | 1055 MT JEFFERSON RD | 2 | | 106 CENTRAL BUFFALO RD | 2 |
|
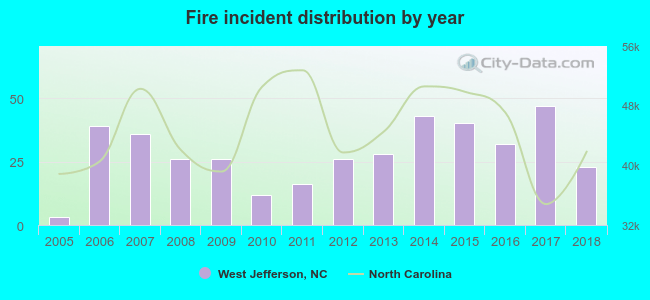 According to the data from the years 2005 - 2018 the average number of fires per year is 28. The highest number of fires - 47 took place in 2017, and the least - 3 in 2005. The data has an increasing trend.
 34.7% incidents where reported in the morning and 65.3% in the evening. The most fires (18.1%) took place on Monday, and the least (10.3%) on Friday.
 Based on the 398 incident reports from years 2005 - 2018 most fires (13.8%) took place during March, and the least (5.0%) in September.
 Out of all 1,503 cases reported during the years 2005 - 2018, the most belonged to the categories: Rescue & EMS (32.8%), Fire (26.5%), and Overpressure Rupture (21.0%).
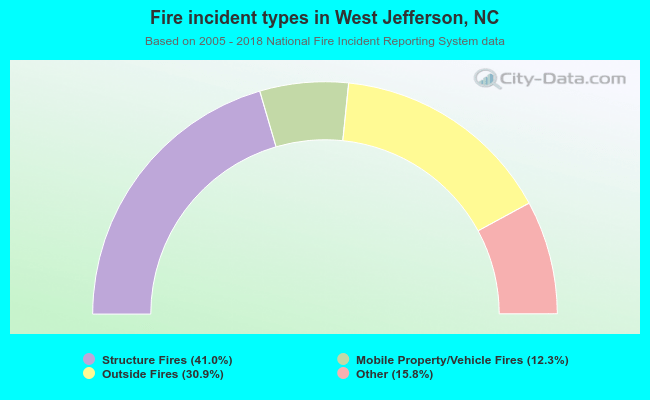 When looking into fire subcategories, the most reports belonged to: Structure Fires (41.0%), and Outside Fires (30.9%).