| Fire incidents reported |
|---|
| Sreet name | Count |
|---|
| PENN AVE | 50 | | WOODSIDE AVE | 30 | | GARFIELD AVE | 24 | | GRANDVIEW BLVD | 22 | | READING AVE | 22 | | CLEVELAND AVE | 12 | | HARVARD BLVD | 12 | | READING BLVD | 12 | | CAMBRIDGE AVE | 10 | | PERKASIE AVE | 10 | | SPRING ST | 10 | | HIGHLAND ST | 8 | | NOBLE ST | 8 | | BELMONT AVE | 6 | | COURT BLVD | 6 | | GRING DR | 6 | | KEPPEL AVE | 6 | | LINCOLN AVE | 6 | | MCKINLEY AVE | 6 | | MONROE AVE | 6 | | READING BOULEVARD | 6 | | STEVENS AVE | 6 | | WEST WYOMISSING BLVD | 6 | | WEST WYOMISSING BLVD. | 6 | | WYOMISSING BLVD | 6 |
| | | Fire incidents reported |
|---|
| Sreet name | Count |
|---|
| DORCHESTER AVE | 4 | | GIRARD AVE | 4 | | INDEPENDENCE DR | 4 | | MCKINELY AVE | 4 | | NORTHFIELD RD | 4 | | PAPERMILL RD | 4 | | PENN AVENUE STA. 65 | 4 | | PORTLAND AVE | 4 | | READING AVENUE | 4 | | SNYDER RD | 4 | | WEST LAWN AVE | 4 | | WYOMISSING CT | 4 | | WYOMISSING HILLS BLVD | 4 | | 222 RT | 2 | | BELL DR | 2 | | BRADLEY AVE | 2 | | BREVITY LANE | 2 | | BURKEY DR | 2 | | CARMAN DR | 2 | | CLEVELAND AVENUE | 2 | | COMMERCE ST | 2 | | DANIEL DR | 2 | | DARLIN DR | 2 | | EAST COURT BLVD | 2 | | |
|
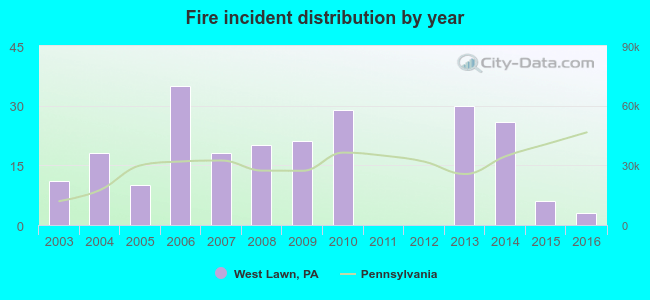 Based on the data from the years 2003 - 2016 the average number of fires per year is 16. The highest number of reported fire incidents - 35 took place in 2006, and the least - 0 in 2011. The data has a dropping trend.
 29.5% incidents where reported in the morning and 70.5% in the evening. The most fires (19.4%) took place on Wednesday, and the least (10.1%) on Tuesday.
 According to the 227 reports from years 2003 - 2016 most fires (12.3%) took place during March, and the least (4.4%) in September.
 Out of all 766 cases reported during the years 2003 - 2016, the most belonged to the categories: Hazardous Condition (33.9%), Fire (29.6%), and Rescue & EMS (12.3%).
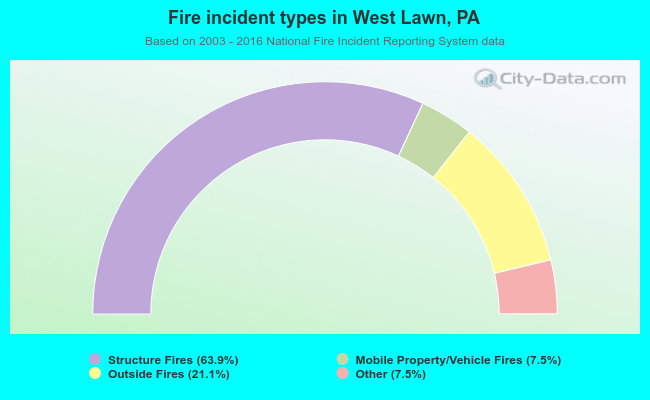 When looking into fire subcategories, the most reports belonged to: Structure Fires (63.9%), and Outside Fires (21.1%).