| Fire incidents reported |
|---|
| Sreet name | Count |
|---|
| MAIN ST | 40 | | WATER ST | 22 | | NORTH WATER STREET | 18 | | COLLINSBURG ROAD | 14 | | 2ND ST | 12 | | GREENSBURG PIKE | 12 | | WATER STREET | 12 | | MT PLEASANT RD | 10 | | SECOND ST | 10 | | THIRD ST | 10 | | NORTH SECOND STREET | 8 | | VINE ST | 8 | | WEST MAIN STREET | 8 | | COLLINSBURG RD | 6 | | HERMINIE-WEST NEWTON RD | 6 | | MAIN STREET | 6 | | PLUMMER SCHOOL ROAD | 6 | | WEDDELL ROAD | 6 | | 1ST ST | 4 | | 3RD ST | 4 | | 555 SUTERSVILLE RD | 4 | | ALLISON ST | 4 | | APPLES MILL RD | 4 | | GALAXY DR | 4 | | GERMAN STREET | 4 |
| | | Fire incidents reported |
|---|
| Sreet name | Count |
|---|
| GREENSBURG PIKE RD | 4 | | IVY LN | 4 | | NORTH 2ND STREET | 4 | | RIO VISTA DR | 4 | | RIO VISTA STREET | 4 | | RIVERSIDE DR | 4 | | ROUTE 906 | 4 | | SOUTH 1ST STREET | 4 | | SOUTH 5TH STREET | 4 | | SUTERSVILLE RD | 4 | | VENABLE ST | 4 | | VOYAGER ESTATES | 4 | | 1016 COLLINSBURG RD | 2 | | 1030 SATELLITE | 2 | | 104 N SECOND ST | 2 | | 107 BEACON LIGHT RD | 2 | | 108 E MAIN | 2 | | 110 WEST MAIN STREET | 2 | | 113 WEST MAIN ST | 2 | | 117 VRENON DR | 2 | | 1260 COAL HOLLOW RD | 2 | | 129 WALNUT LN | 2 | | 145 N 2ND ST | 2 | | 158 NORTH WATER STREET | 2 | | |
|
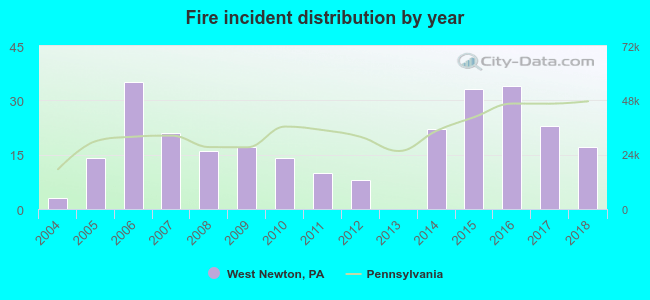 Based on the data from the years 2004 - 2018 the average number of fires per year is 18. The highest number of reported fire incidents - 35 took place in 2006, and the least - 0 in 2013. The data has a growing trend.
 31.5% incidents where reported in the morning and 68.5% in the evening. The most fires (16.9%) took place on Wednesday, and the least (12.0%) on Friday.
 According to the 267 reports from years 2004 - 2018 most fires (18.4%) took place during March, and the least (3.0%) in October.
 Out of all 1,080 cases reported during the years 2004 - 2018, the most belonged to the categories: Rescue & EMS (30.0%), Fire (24.7%), and Hazardous Condition (17.9%).
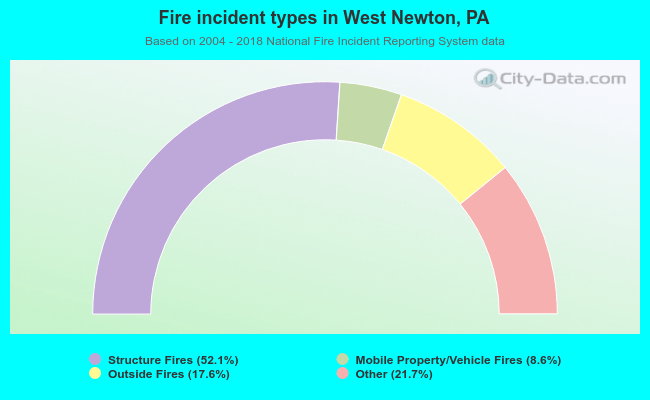 When looking into fire subcategories, the most reports belonged to: Structure Fires (52.1%), and Other (21.7%).