| Fire incidents reported |
|---|
| Sreet name | Count |
|---|
| LUZERNE AVE | 20 | | EXETER AVE | 12 | | MONTGOMERY AVE | 10 | | FRANKLIN ST | 8 | | SEARFOSS RD | 8 | | SUSQUEHANNA AVE | 8 | | WYOMING AVE | 8 | | DELAWARE AVE | 6 | | FOUNDRY ST | 6 | | FREMONT ST | 6 | | SPRING ST | 6 | | 203 DELAWARE AVE | 4 | | 408 LUZERNE AVE | 4 | | 611 EXETER AVE | 4 | | ANN ST | 4 | | CHASE ST | 4 | | LINDEN ST | 4 | | NASSAU ST | 4 | | SIXTH ST | 4 | | SPRING184 ST | 4 | | WASHINGTON ST | 4 | | 106 BOSTON AVE | 2 | | 1324 SUSQUEHANNA AVE | 2 | | 133 ELME ST | 2 | | 182 SUSQUEHANNA AVE | 2 |
| | | Fire incidents reported |
|---|
| Sreet name | Count |
|---|
| 200 FRANKLIN ST | 2 | | 200 WYOMING AVE | 2 | | 324 DELEWARE | 2 | | 4 TH STREET | 2 | | 4TH ST AND PACIFIC AVE | 2 | | 509 WYOMING AVE | 2 | | 524 WYOMING AVE | 2 | | 6 TH ST | 2 | | 603 MOUNTGOMERY | 2 | | 6TH | 2 | | 6TH184 ST | 2 | | 84 FREEMOUNT ST | 2 | | B3 BBQ | 2 | | BOSTON AVE | 2 | | CARPENTER ST | 2 | | CLYDE ST | 2 | | CLYED | 2 | | DAMON ST | 2 | | DELAWARE AVE | 2 | | DELAWARE ST | 2 | | EXETER AVE AVE | 2 | | FREMONT ST | 2 | | GASHI RD | 2 | | LEDGEVIEW DR | 2 | | LINDEN (184) ST | 2 |
|
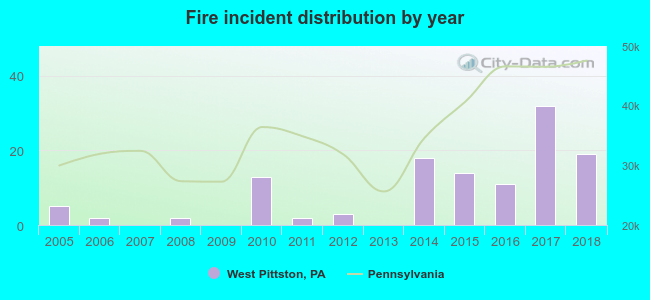 Based on the data from the years 2005 - 2018 the average number of fires per year is 9. The highest number of reported fire incidents - 32 took place in 2017, and the least - 0 in 2007. The data has a growing trend.
 27.3% incidents where reported in the morning and 72.7% in the evening. The most fires (19.8%) took place on Wednesday, and the least (5.0%) on Saturday.
 According to the 121 reports from years 2005 - 2018 most fires (15.7%) took place during April, and the least (2.5%) in June.
 Out of all 503 cases reported during the years 2005 - 2018, the most belonged to the categories: Fire (24.1%), Good Intent Call (20.5%), and Rescue & EMS (16.5%).
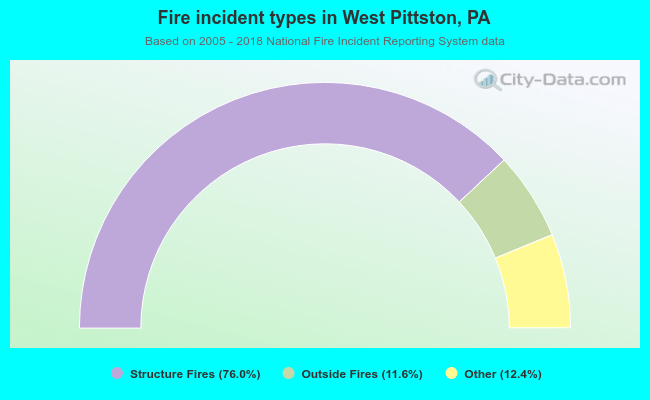 When looking into fire subcategories, the most reports belonged to: Structure Fires (76.0%), and Outside Fires (12.4%).