| Fire incidents reported |
|---|
| Sreet name | Count |
|---|
| VINE ST | 16 | | 150 HWY | 10 | | 240TH ST | 8 | | GOLDEN RD | 8 | | JUNIPER RD | 8 | | WALNUT ST | 8 | | 220TH ST | 6 | | 230TH ST | 6 | | 7257 GOLDEN ROAD | 6 | | GREAT RIVER RD | 6 | | HGY. 18 EAST POSTVILLE | 6 | | 109 S. VINE STREET | 4 | | 11053 GREAT RIVER ROAD | 4 | | 13476 230TH STREET | 4 | | 13646 240TH STREET | 4 | | 21518 HORNET ROAD | 4 | | 230TH STREET HWY. 18 WEST | 4 | | 24735 MUSKRAT ROAD | 4 | | 7912 ECHO VALLEY ROAD | 4 | | ECHO VALLEY RACEWAY | 4 | | ELM ST | 4 | | ELM STA | 4 | | HIGHWAY 18 HWY | 4 | | HOLLYWOOD BLVD | 4 | | J AVE | 4 |
| | | Fire incidents reported |
|---|
| Sreet name | Count |
|---|
| KALE RD | 4 | | LANE RD | 4 | | NATURE RD | 4 | | ORANGE RD | 4 | | PRAIRIE VIEW RR W. U. | 4 | | RAILROAD STREET | 4 | | 103 4TH ST. NE | 2 | | 105 EAST MAIN STREET | 2 | | 105 HOLLYWOOD BLVD. | 2 | | 105 LINCOLN COURT | 2 | | 106 CHERRY STREET | 2 | | 106 GOLDEN ROAD | 2 | | 11008 FILMORE ROAD | 2 | | 11009 FILMORE ROAD | 2 | | 11025 275TH STREET | 2 | | 11051 GREAT RIVER ROAD | 2 | | 112 EAST ELM APTS. | 2 | | 117 CEDAR STREET | 2 | | 11714 GREAT RIVER ROAD | 2 | | 11720 210TH STREET | 2 | | 118 EAST ELM | 2 | | 11986 190TH STREET | 2 | | 12072 KING ROAD | 2 | | 122 EAST ELM ALLEY | 2 | | |
|
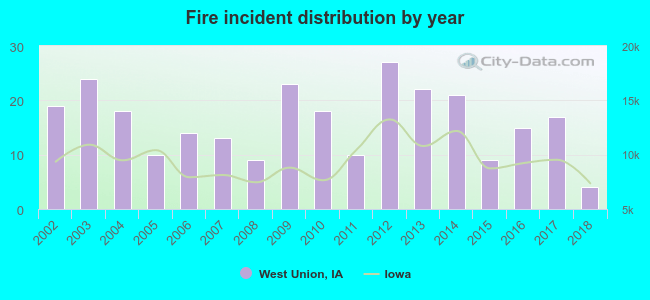 According to the data from the years 2002 - 2018 the average number of fire incidents per year is 16. The highest number of fire incidents - 27 took place in 2012, and the least - 4 in 2018. The data has a dropping trend.
 25.6% incidents where reported in the morning and 74.4% in the evening. The most fires (20.1%) took place on Saturday, and the least (9.2%) on Thursday.
 According to the 273 fire incidents from years 2002 - 2018 most fires (23.1%) took place during April, and the least (3.3%) in February.
 Out of all 518 cases reported during the years 2002 - 2018, the most belonged to the categories: Fire (52.7%), Hazardous Condition (29.2%), and Rescue & EMS (5.2%).
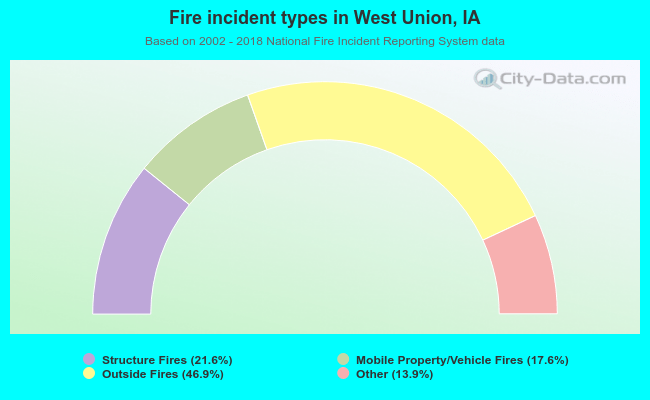 When looking into fire subcategories, the most incidents belonged to: Outside Fires (46.9%), and Structure Fires (21.6%).