West Unity: Fire Incidents, Ohio (OH)
Where are fire incidents reported in West Unity, OH
Something went wrong! Please refresh the page.
|
| |||||||||||||||||||||||||||||||||||||||||||||||||||||||||||||||||||||||||||||||||||||||||||||||||||||||||||||
2002 - 2018 National Fire Incident Reporting System (NFIRS) incidents
- Incident types reported to NFIRS in West Unity, OH
- 34543.2%Fire
- 28836.0%Hazardous Condition
- 597.4%Service Call
- 415.1%Rescue & EMS
- 394.9%Good Intent Call
- 253.1%False Alarm
- 10.1%Severe Weather
- 10.1%Special Incident
- Fire incident types reported to NFIRS in West Unity, OH
- 17049.3%Structure Fires
- 11433.0%Outside Fires
- 6117.7%Mobile Property/Vehicle Fires
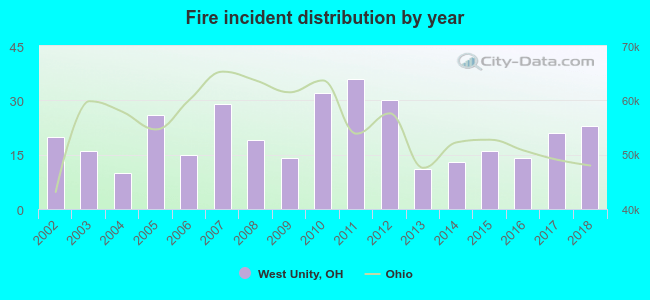 According to the data from the years 2002 - 2018 the average number of fires per year is 20. The highest number of reported fires - 36 took place in 2011, and the least - 10 in 2004. The data has a rising trend.
 According to the reports from the years 2002 - 2018 the average number of fire-related casualties per year is 0. The highest number of reported casualties - 3 took place in 2002, and the lowest - 0 in 2003. The data has a declining trend.
 31.3% incidents where reported in the morning and 68.7% in the evening. The most fires (18.8%) took place on Monday, and the least (11.3%) on Thursday.
 According to the 345 fire incidents from years 2002 - 2018 most fires (11.0%) took place during November, and the least (4.9%) in February.
 Out of all 799 cases reported during the years 2002 - 2018, the most belonged to the categories: Fire (43.2%), Rescue & EMS (36.0%), and Hazardous Condition (7.4%).
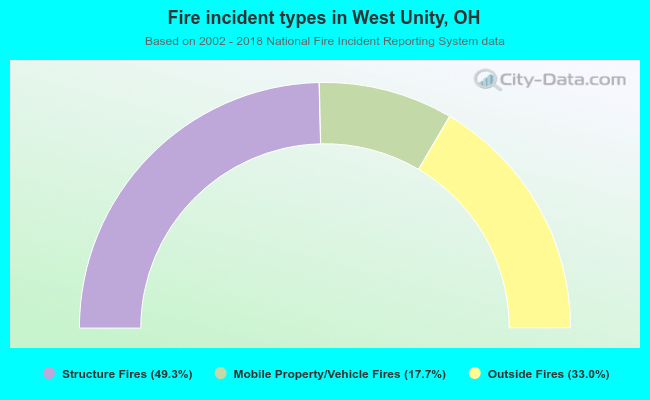 When looking into fire subcategories, the most incidents belonged to: Structure Fires (49.3%), and Outside Fires (33.0%).