Westfield: Fire Incidents, New Jersey (NJ)
Where are fire incidents reported in Westfield, NJ
Something went wrong! Please refresh the page.
| Fire incidents reported | |
|---|---|
| Sreet name | Count |
| BROAD ST | 176 |
| NORTH AVE | 146 |
| SOUTH AVE | 132 |
| CENTRAL AVE | 114 |
| ELM ST | 92 |
| PROSPECT ST | 70 |
| BOYNTON AVE | 64 |
| WESTFIELD AVE | 46 |
| RAHWAY AVE | 38 |
| SPRINGFIELD AVE | 36 |
| FOREST AVE | 28 |
| SUMMIT AVE | 28 |
| CLARK ST | 26 |
| LENOX AVE | 26 |
| MOUNTAIN AVE | 26 |
| ELM | 24 |
| LAMBERTS MILL RD | 24 |
| BOULEVARD | 22 |
| FIRST ST | 22 |
| BARCHESTER WAY | 20 |
| DUDLEY AVE | 20 |
| ELMER ST | 20 |
| FAIRMONT AVE | 20 |
| HILLCREST AVE | 20 |
| KIMBALL AVE | 20 |
| LAWRENCE AVE | 20 |
| TRINITY PL | 20 |
| WYCHWOOD RD | 20 |
| DORIAN RD | 18 |
| CHESTNUT ST | 16 |
| Other | 80 |
2003 - 2018 National Fire Incident Reporting System (NFIRS) incidents
- Incident types reported to NFIRS in Westfield, NJ
- 5,36047.6%Hazardous Condition
- 1,88616.7%False Alarm
- 1,43412.7%Fire
- 1,0609.4%Rescue & EMS
- 9748.6%Service Call
- 4103.6%Good Intent Call
- 860.8%Severe Weather
- 350.3%Special Incident
- 190.2%Overpressure Rupture
- Fire incident types reported to NFIRS in Westfield, NJ
- 1,01270.6%Structure Fires
- 29420.5%Outside Fires
- 926.4%Mobile Property/Vehicle Fires
- 362.5%Other
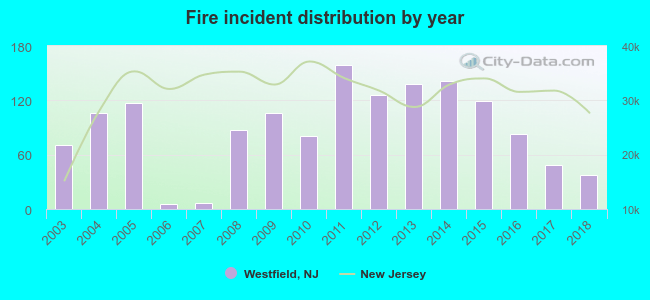 According to the data from the years 2003 - 2018 the average number of fire incidents per year is 90. The highest number of fires - 159 took place in 2011, and the least - 6 in 2006. The data has a decreasing trend.
The average number of yearly fire incidents per 10k residents in Westfield, NJ compared to nearest cities:
(Note: Based on data for the last 3 years, including only cities with population 5,000 and above)
| Westfield: | 18.3 |
| Scotch Plains: | 31.4 |
| Cranford: | 27.6 |
| Mountainside: | 19.0 |
| Fanwood: | 9.6 |
| Clark: | 30.3 |
| Kenilworth: | 14.3 |
| Springfield: | 44.0 |
| Roselle Park: | 13.5 |
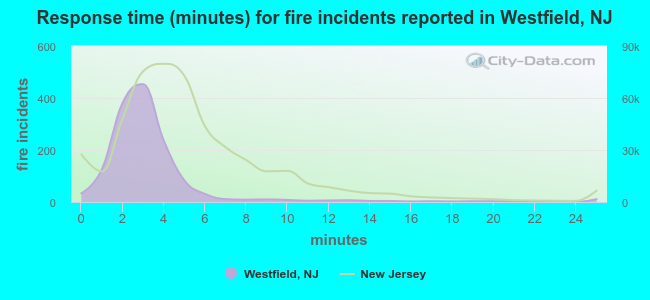 The median response time based on all reported fire incidents is 3 minutes. This is lower compared to the New Jersey median value.
The median response time in Westfield, NJ compared to nearest cities:
(Note: Based on data for all years, including only cities with at least 500 fire incidents)
| Westfield: | 3 minutes |
| Scotch Plains: | 6 minutes |
| Cranford: | 4 minutes |
| Clark: | 6 minutes |
| Springfield: | 5 minutes |
| Colonia: | 5 minutes |
| Roselle: | 3 minutes |
| Rahway: | 3 minutes |
| Plainfield: | 5 minutes |
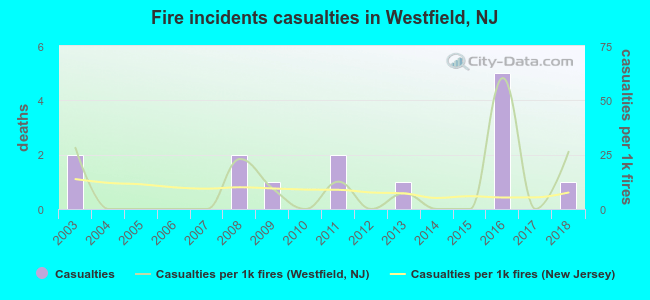 According to the data from the years 2003 - 2018 the average number of fire-related casualties per year is 1. The highest number of reported casualties - 5 took place in 2016, and the lowest - 0 in 2004. The data has a declining trend.
The average number of casualties per 1,000 fire incidents is 10. This indicator was the highest - 60 in 2016, and the lowest 0 in 2004. The trend for injuries per 1,000 incidents is declining. Compared to the state value the number of casualties per 1,000 fires is similar.
According to the data from the years 2003 - 2018 the average number of fire-related casualties per year is 1. The highest number of reported casualties - 5 took place in 2016, and the lowest - 0 in 2004. The data has a declining trend.
The average number of casualties per 1,000 fire incidents is 10. This indicator was the highest - 60 in 2016, and the lowest 0 in 2004. The trend for injuries per 1,000 incidents is declining. Compared to the state value the number of casualties per 1,000 fires is similar.Casualties per 1,000 incidents in Westfield, NJ compared to nearest cities:
(Note: Based on data for all years, including only cities with at least 500 fire incidents)
| Westfield: | 9.8 |
| Scotch Plains: | 4.8 |
| Cranford: | 19.9 |
| Clark: | 14.5 |
| Springfield: | 6.7 |
| Colonia: | 5.7 |
| Roselle: | 28.9 |
| Rahway: | 8.9 |
| Plainfield: | 16.7 |
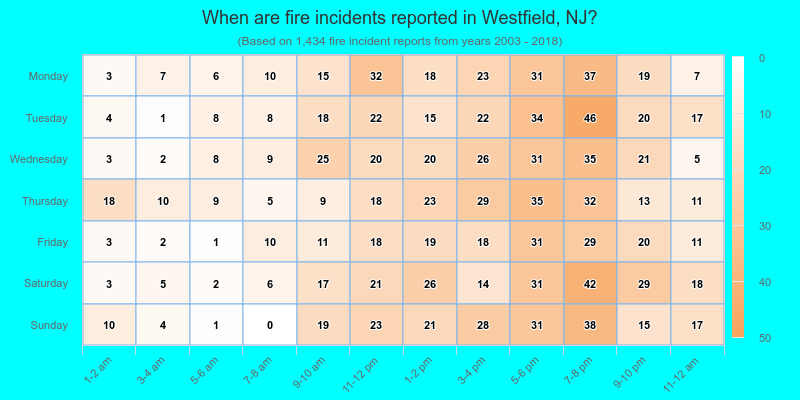
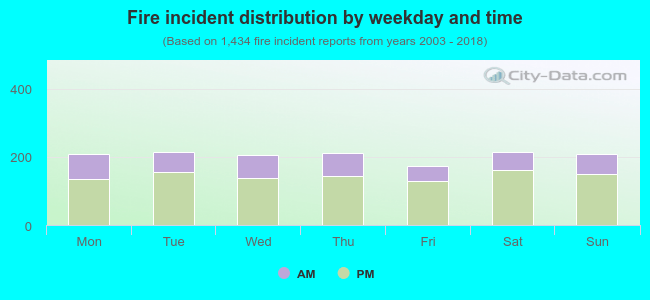 29.7% incidents where reported in the morning and 70.3% in the evening. The most fires (15.0%) took place on Tuesday, and the least (12.1%) on Friday.
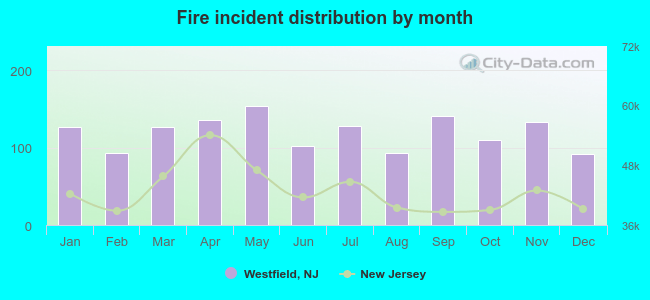 According to the 1,434 fire incident reports from years 2003 - 2018 most fires (10.7%) took place during May, and the least (6.4%) in December.
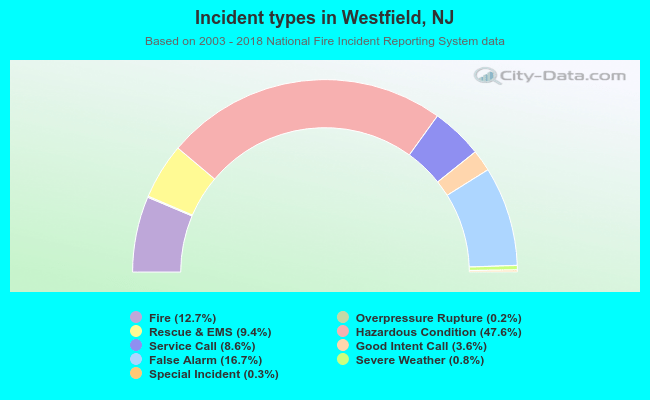 Out of all 11,264 cases reported during the years 2003 - 2018, the most belonged to the categories: Hazardous Condition (47.6%), False Alarm (16.7%), and Fire (12.7%).
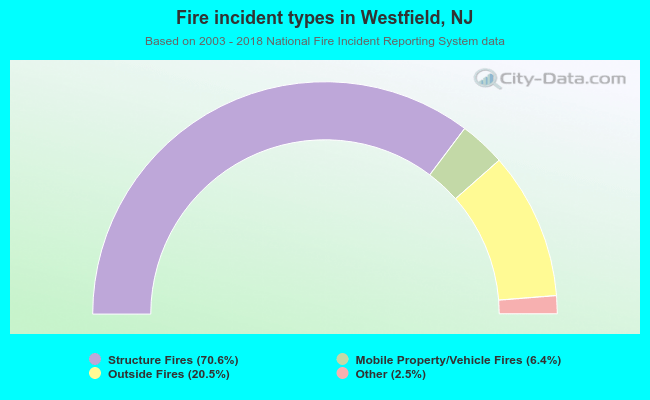 When looking into fire subcategories, the most incidents belonged to: Structure Fires (70.6%), and Outside Fires (20.5%).