| Fire incidents reported |
|---|
| Sreet name | Count |
|---|
| 2150 STATE HWY 9 | 6 | | 1 SOUTH OF VET CLINIC | 4 | | 105 BARNSWALLOW | 4 | | 14 MILE WEST OF 64TH W | 4 | | 16TH AND U ROAD | 4 | | 205 THIRD STREET | 4 | | 32ND AND T4 ROAD | 4 | | 56TH AND X ROAD | 4 | | 607 MINNESTOTA | 4 | | 8TH & Y RD | 4 | | NETAWAKA | 4 | | .5 SOUTH OF BANCROFT | 2 | | 1 EAST & 1.5 NORTH OF WET | 2 | | 1 MILE N OF #9 ON 75 HWY | 2 | | 1 MILE N OF K-20 ON 75 | 2 | | 1 SOUTH & 2 .5 WEST | 2 | | 1.5 MILES WEST ON K-9 | 2 | | 1/2 MI E OF BANCROFT N SIDE RD | 2 | | 1/2 NORTH OF K-9 ON V RD | 2 | | 104TH AND U ROAD | 2 | | 1083 V RD | 2 | | 110 AND ANTALOPE ROAD | 2 | | 110 BITTERSWEET ROAD | 2 | | 1120 ACORN RD | 2 | | 1159 BITTERSWEET RD | 2 |
| | | Fire incidents reported |
|---|
| Sreet name | Count |
|---|
| 120 & ANTLOPE | 2 | | 120TH ACORN & ANTALOPE | 2 | | 120TH ANTALOPE | 2 | | 120TH U ROAD | 2 | | 1228 W RD | 2 | | 128TH ROAD BETWEEN U AND T ROA | 2 | | 130TH ACORN ROAD | 2 | | 130TH AND ACORN | 2 | | 130TH AND ANTELOPE ROAD | 2 | | 1339 BITTERSWEET | 2 | | 1394 ACORN | 2 | | 1394 ACORN RD | 2 | | 140TH AND Y ROAD | 2 | | 145TH ST | 2 | | 15 MILES W OF TRUCK PLZA | 2 | | 150TH RD | 2 | | 16TH & T | 2 | | 170 145TH RD | 2 | | 170 145TH ROAD | 2 | | 2.5 MILES S. OF BANCROFT | 2 | | 2007 64TH ROAD | 2 | | 2012 32ND ROAD | 2 | | 2074 64TH RD | 2 | | 208 2ND STREET | 2 | | |
|
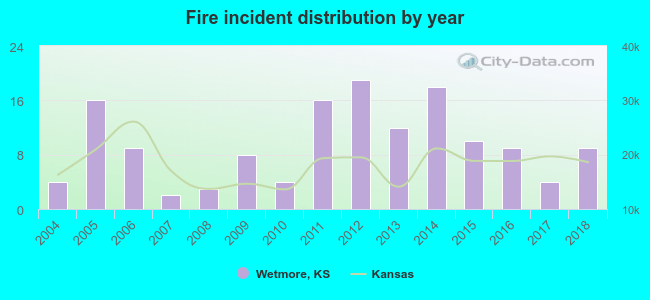 According to the data from the years 2004 - 2018 the average number of fires per year is 10. The highest number of reported fires - 19 took place in 2012, and the least - 2 in 2007. The data has an increasing trend.
 11.9% incidents where reported in the morning and 88.1% in the evening. The most fires (22.4%) took place on Friday, and the least (9.8%) on Monday.
 Based on the 143 fire incidents from years 2004 - 2018 most fires (38.5%) took place during March, and the least (0.7%) in August.
 Out of all 252 cases reported during the years 2004 - 2018, the most belonged to the categories: Fire (56.7%), Overpressure Rupture (40.5%), and Rescue & EMS (2.4%).
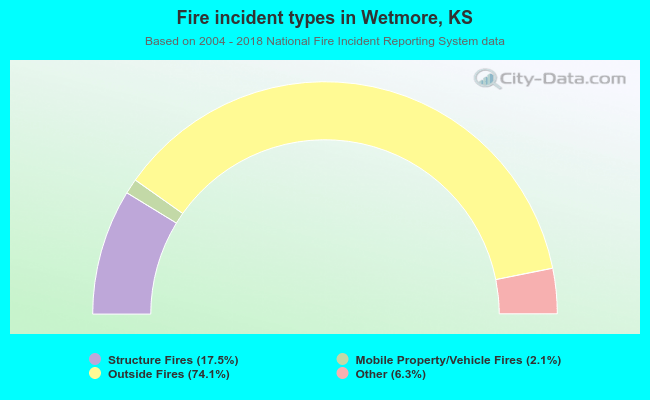 When looking into fire subcategories, the most reports belonged to: Outside Fires (74.1%), and Structure Fires (17.5%).