| Fire incidents reported |
|---|
| Sreet name | Count |
|---|
| NIBLACK ST | 50 | | MAIN ST | 46 | | ADAMS ST | 28 | | RAILROAD ST | 24 | | HWY 50 EAST OF WHEATLAND | 22 | | HWY 50 WEST OF WHEATLAND | 20 | | NIMNICHT RD | 20 | | STRAWBERRY HALL RD | 18 | | OLD 50 HWY | 16 | | BICKNELL RD | 14 | | WASHINGTON ST | 14 | | OLD HWY 50 HWY | 12 | | SEMINARY ST | 12 | | EVANS RD | 10 | | APRAW RD | 8 | | HWY 550 | 8 | | PETERSBURG RD | 8 | | STATE ROAD 550 HWY | 8 | | 730 E MAIN ST | 6 | | HWY 550 NORTH OF WHEATLAD | 6 | | LOUISVILLE ST | 6 | | NICHOLSON ST | 6 | | SUMMERS RD | 6 | | SYCAMORE ST | 6 | | 241 HWY | 4 |
| | | Fire incidents reported |
|---|
| Sreet name | Count |
|---|
| 2941 S ST RD 241 | 4 | | 715 W OLD HWY 50 | 4 | | 751 WASHINGTON ST. | 4 | | APRAW RD. | 4 | | BOTTOMS RD | 4 | | BOTTOMS RD | 4 | | BUD RD | 4 | | CATES RD | 4 | | ENLEY RD | 4 | | HALL RD | 4 | | HALL RD. | 4 | | HICKMAN ST | 4 | | HWY 241 | 4 | | HWY 50 | 4 | | HWY 50 AND HWY 241 | 4 | | MARCHINO RD | 4 | | NIMINICHT RD | 4 | | PATRICK RD | 4 | | RICKETS RD | 4 | | SHORT ST | 4 | | 100 OVERBAY ST. | 2 | | 110 E. MAIN | 2 | | 11425 E EVANS RD | 2 | | 118 N. HICKMAN ST. | 2 | | |
|
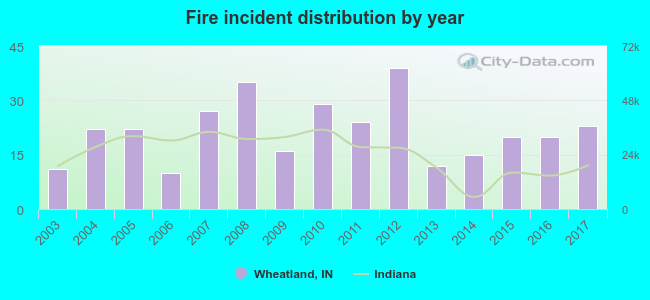 According to the data from the years 2003 - 2017 the average number of fires per year is 22. The highest number of reported fire incidents - 39 took place in 2012, and the least - 10 in 2006. The data has a growing trend.
 20.6% incidents where reported in the morning and 79.4% in the evening. The most fires (17.2%) took place on Saturday, and the least (11.7%) on Tuesday.
 Based on the 325 incident reports from years 2003 - 2017 most fires (12.9%) took place during March, and the least (5.2%) in May.
 Out of all 689 cases reported during the years 2003 - 2017, the most belonged to the categories: Fire (47.2%), Rescue & EMS (29.3%), and Hazardous Condition (9.6%).
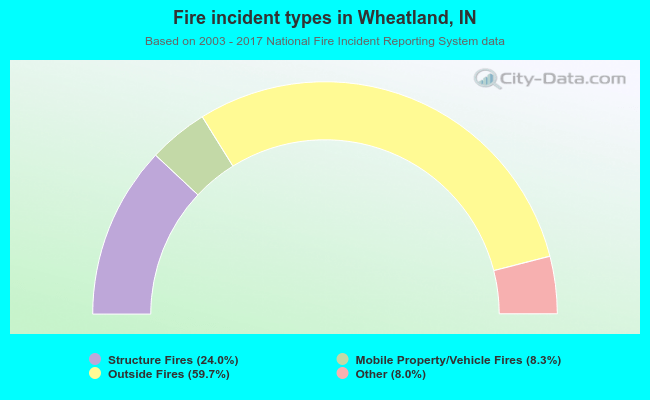 When looking into fire subcategories, the most reports belonged to: Outside Fires (59.7%), and Structure Fires (24.0%).