White Castle: Fire Incidents, Louisiana (LA)
Where are fire incidents reported in White Castle, LA
Something went wrong! Please refresh the page.
|
| |||||||||||||||||||||||||||||||||||||||||||||||||||||||||||||||||||||||||||||||||||||||||||||||||||||||||||||
2004 - 2018 National Fire Incident Reporting System (NFIRS) incidents
- Incident types reported to NFIRS in White Castle, LA
- 41354.1%Rescue & EMS
- 21628.3%Fire
- 709.2%Hazardous Condition
- 263.4%Good Intent Call
- 253.3%False Alarm
- 50.7%Service Call
- 50.7%Severe Weather
- 20.3%Overpressure Rupture
- 20.3%Special Incident
- Fire incident types reported to NFIRS in White Castle, LA
- 7434.3%Outside Fires
- 5927.3%Other
- 4822.2%Structure Fires
- 3516.2%Mobile Property/Vehicle Fires
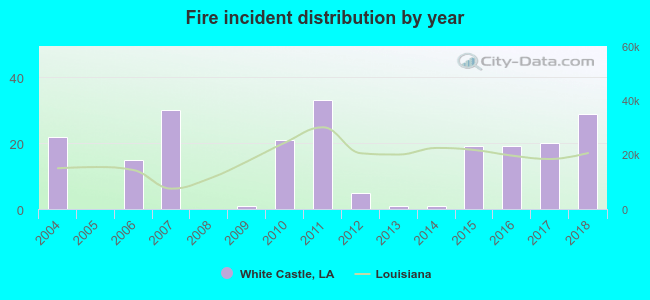 According to the data from the years 2004 - 2018 the average number of fire incidents per year is 14. The highest number of reported fires - 33 took place in 2011, and the least - 0 in 2005. The data has a growing trend.
 34.7% incidents where reported in the morning and 65.3% in the evening. The most fires (20.4%) took place on Friday, and the least (11.6%) on Sunday.
 According to the 216 fire incidents from years 2004 - 2018 most fires (13.9%) took place during November, and the least (4.2%) in August.
 Out of all 764 cases reported during the years 2004 - 2018, the most belonged to the categories: Rescue & EMS (54.1%), Fire (28.3%), and Hazardous Condition (9.2%).
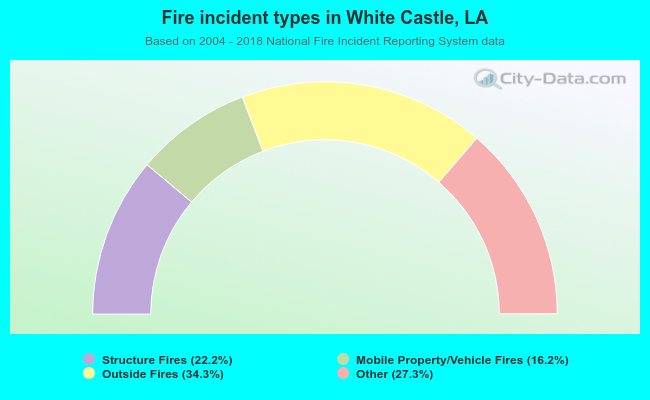 When looking into fire subcategories, the most incidents belonged to: Outside Fires (34.3%), and Other (27.3%).