Whiteland: Fire Incidents, Indiana (IN)
Where are fire incidents reported in Whiteland, IN
Something went wrong! Please refresh the page.
|
| |||||||||||||||||||||||||||||||||||||||||||||||||||||||||||||||||||||||||||||||||||||||||||||||||||||||||||||
2002 - 2018 National Fire Incident Reporting System (NFIRS) incidents
- Incident types reported to NFIRS in Whiteland, IN
- 1,25852.0%Rescue & EMS
- 42417.5%Fire
- 28111.6%Hazardous Condition
- 1837.6%Good Intent Call
- 1496.2%Service Call
- 863.6%False Alarm
- 210.9%Special Incident
- 170.7%Severe Weather
- Fire incident types reported to NFIRS in Whiteland, IN
- 15135.6%Structure Fires
- 13431.6%Outside Fires
- 9522.4%Mobile Property/Vehicle Fires
- 4410.4%Other
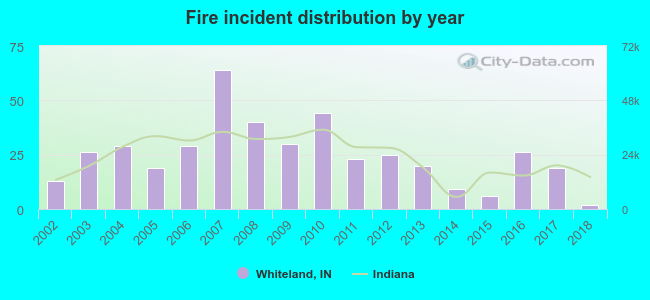 According to the data from the years 2002 - 2018 the average number of fires per year is 25. The highest number of reported fire incidents - 64 took place in 2007, and the least - 2 in 2018. The data has a dropping trend.
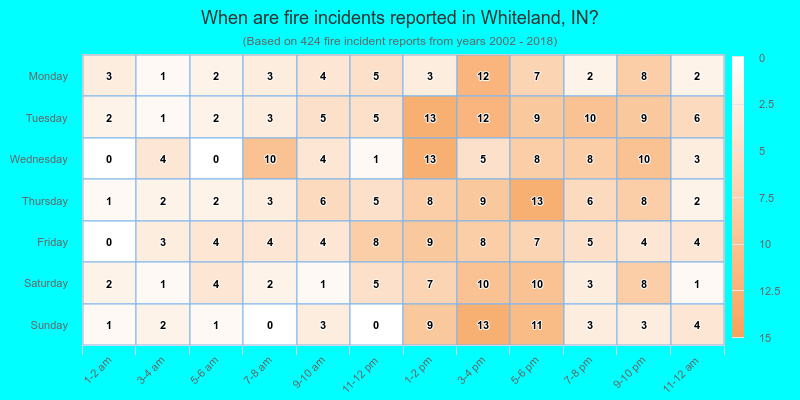
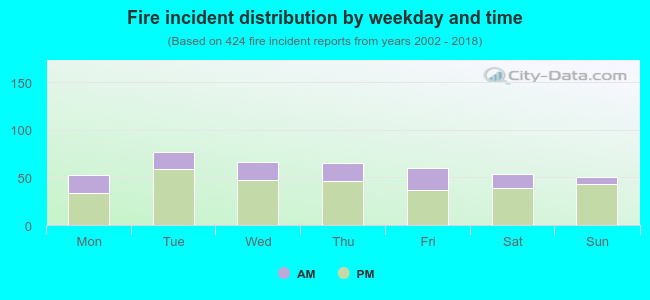 28.1% incidents where reported in the morning and 71.9% in the evening. The most fires (18.2%) took place on Tuesday, and the least (11.8%) on Sunday.
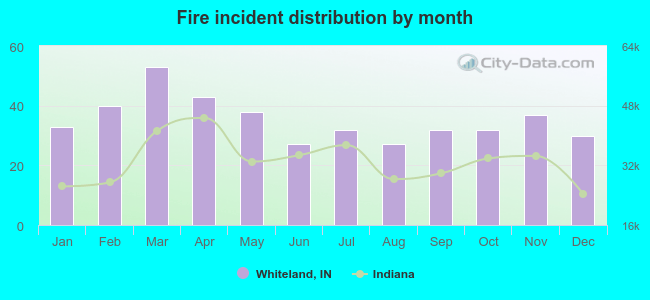 Based on the 424 incident reports from years 2002 - 2018 most fires (12.5%) took place during March, and the least (6.4%) in June.
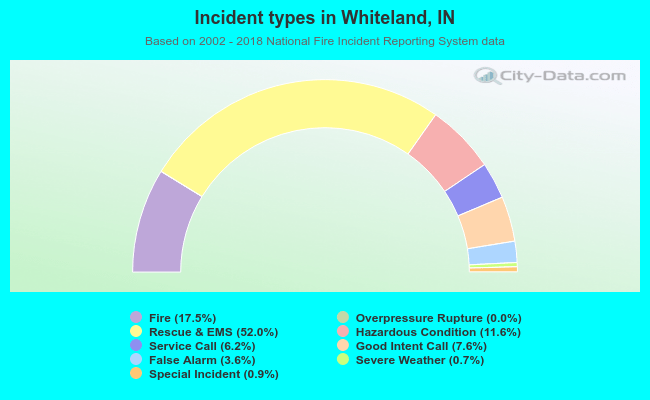 Out of all 2,420 cases reported during the years 2002 - 2018, the most belonged to the categories: Rescue & EMS (52.0%), Fire (17.5%), and Hazardous Condition (11.6%).
 When looking into fire subcategories, the most reports belonged to: Structure Fires (35.6%), and Outside Fires (31.6%).