Whitesboro: Fire Incidents, New York (NY)
Where are fire incidents reported in Whitesboro, NY
Something went wrong! Please refresh the page.
|
| |||||||||||||||||||||||||||||||||||||||||||||||||||||||||||||||||||||||||||||||||||||||||||||||||||||||||||||
2002 - 2018 National Fire Incident Reporting System (NFIRS) incidents
- Incident types reported to NFIRS in Whitesboro, NY
- 2,63558.1%Rescue & EMS
- 52111.5%Good Intent Call
- 4449.8%Hazardous Condition
- 3297.2%Fire
- 3177.0%Service Call
- 2595.7%False Alarm
- 310.7%Severe Weather
- Fire incident types reported to NFIRS in Whitesboro, NY
- 21264.4%Structure Fires
- 5215.8%Mobile Property/Vehicle Fires
- 5215.8%Outside Fires
- 134.0%Other
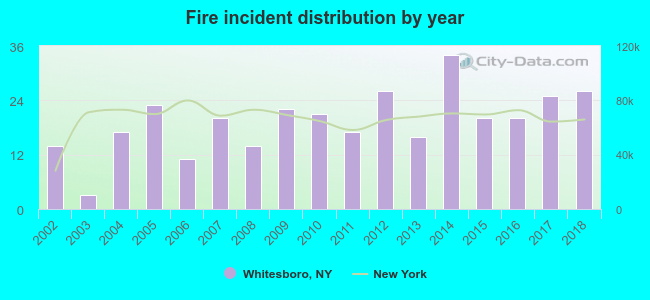 Based on the data from the years 2002 - 2018 the average number of fires per year is 19. The highest number of reported fires - 34 took place in 2014, and the least - 3 in 2003. The data has a growing trend.
 34.0% incidents where reported in the morning and 66.0% in the evening. The most fires (17.3%) took place on Wednesday, and the least (11.9%) on Monday.
 According to the 329 fires from years 2002 - 2018 most fires (12.2%) took place during February, and the least (6.4%) in January.
 Out of all 4,538 cases reported during the years 2002 - 2018, the most belonged to the categories: Rescue & EMS (58.1%), Good Intent Call (11.5%), and Hazardous Condition (9.8%).
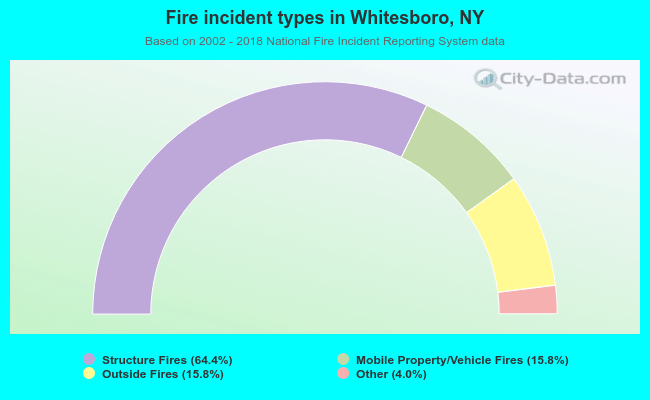 When looking into fire subcategories, the most reports belonged to: Structure Fires (64.4%), and Mobile Property/Vehicle Fires (15.8%).