Whitewater: Fire Incidents, Kansas (KS)
Where are fire incidents reported in Whitewater, KS
Something went wrong! Please refresh the page.
|
| |||||||||||||||||||||||||||||||||||||||||||||||||||||||||||||||||||||||||||||||||||||||||||||||||||||||||||||
2002 - 2018 National Fire Incident Reporting System (NFIRS) incidents
- Incident types reported to NFIRS in Whitewater, KS
- 79861.6%Rescue & EMS
- 29823.0%Fire
- 947.3%Good Intent Call
- 534.1%Hazardous Condition
- 231.8%Service Call
- 221.7%False Alarm
- 40.3%Severe Weather
- 30.2%Special Incident
- Fire incident types reported to NFIRS in Whitewater, KS
- 19565.4%Outside Fires
- 6321.1%Structure Fires
- 299.7%Mobile Property/Vehicle Fires
- 113.7%Other
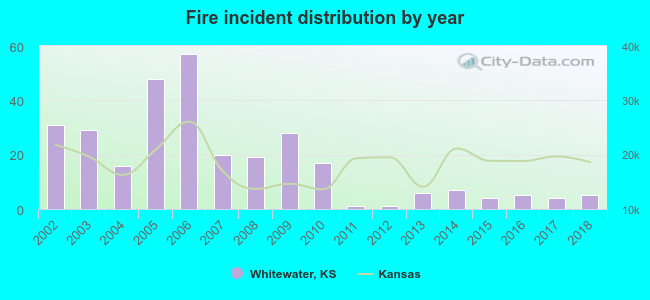 According to the data from the years 2002 - 2018 the average number of fires per year is 18. The highest number of reported fire incidents - 57 took place in 2006, and the least - 1 in 2011. The data has a decreasing trend.
 25.8% incidents where reported in the morning and 74.2% in the evening. The most fires (21.1%) took place on Saturday, and the least (9.7%) on Monday.
 Based on the 298 fires from years 2002 - 2018 most fires (15.1%) took place during March, and the least (4.4%) in September.
 Out of all 1,295 cases reported during the years 2002 - 2018, the most belonged to the categories: Overpressure Rupture (61.6%), Fire (23.0%), and Service Call (7.3%).
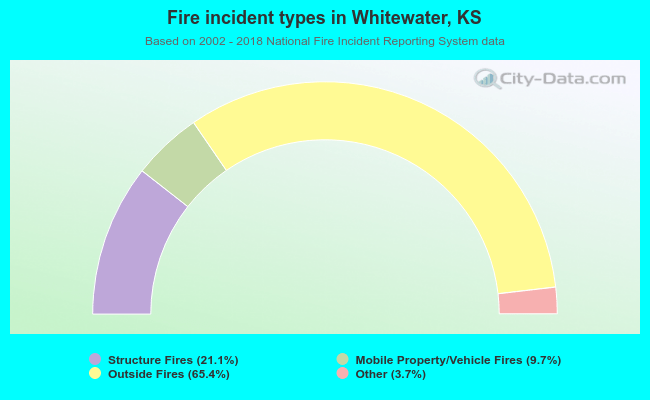 When looking into fire subcategories, the most incidents belonged to: Outside Fires (65.4%), and Structure Fires (21.1%).