Wilkinson: Fire Incidents, Indiana (IN)
Where are fire incidents reported in Wilkinson, IN
Something went wrong! Please refresh the page.
|
| |||||||||||||||||||||||||||||||||||||||||||||||||||||||||||||||||||||||||||||||||||||||||||||||||||||||||||||
2002 - 2017 National Fire Incident Reporting System (NFIRS) incidents
- Incident types reported to NFIRS in Wilkinson, IN
- 14640.4%Rescue & EMS
- 12534.6%Fire
- 4011.1%Good Intent Call
- 318.6%Hazardous Condition
- 185.0%Service Call
- 10.3%False Alarm
- Fire incident types reported to NFIRS in Wilkinson, IN
- 5544.0%Structure Fires
- 4737.6%Outside Fires
- 2116.8%Mobile Property/Vehicle Fires
- 21.6%Other
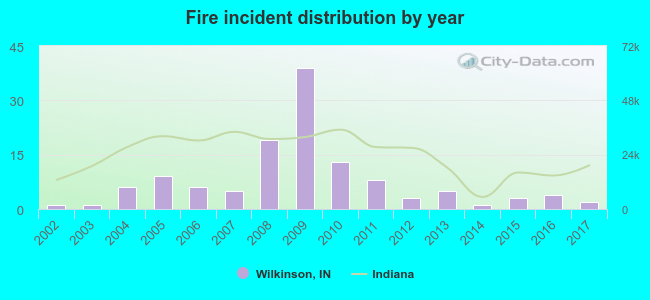 According to the data from the years 2002 - 2017 the average number of fires per year is 8. The highest number of reported fire incidents - 39 took place in 2009, and the least - 1 in 2002. The data has a growing trend.
 24.0% incidents where reported in the morning and 76.0% in the evening. The most fires (17.6%) took place on Sunday, and the least (8.0%) on Thursday.
 Based on the 125 incident reports from years 2002 - 2017 most fires (23.2%) took place during March, and the least (0.8%) in April.
 Out of all 361 cases reported during the years 2002 - 2017, the most belonged to the categories: Overpressure Rupture (40.4%), Fire (34.6%), and Service Call (11.1%).
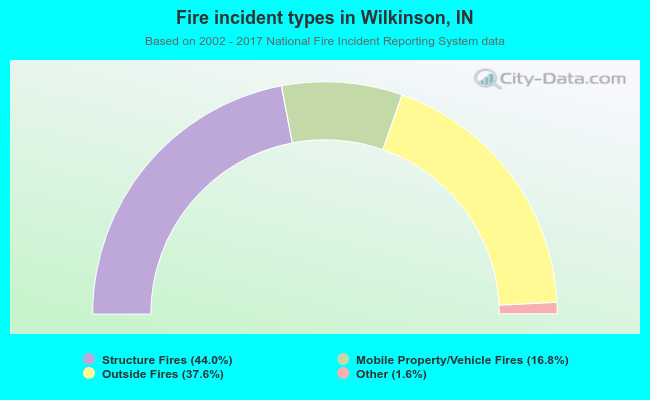 When looking into fire subcategories, the most reports belonged to: Structure Fires (44.0%), and Outside Fires (37.6%).