Williamsburg: Fire Incidents, Iowa (IA)
Where are fire incidents reported in Williamsburg, IA
Something went wrong! Please refresh the page.
|
| |||||||||||||||||||||||||||||||||||||||||||||||||||||||||||||||||||||||||||||||||||||||||||||||||||||||||||||
| Other | 19 | |||||||||||||||||||||||||||||||||||||||||||||||||||||||||||||||||||||||||||||||||||||||||||||||||||||||||||||
2002 - 2018 National Fire Incident Reporting System (NFIRS) incidents
- Incident types reported to NFIRS in Williamsburg, IA
- 39567.9%Fire
- 7212.4%Hazardous Condition
- 376.4%Good Intent Call
- 325.5%Rescue & EMS
- 234.0%False Alarm
- 142.4%Service Call
- 71.2%Overpressure Rupture
- 10.2%Severe Weather
- 10.2%Special Incident
- Fire incident types reported to NFIRS in Williamsburg, IA
- 21855.2%Outside Fires
- 8621.8%Mobile Property/Vehicle Fires
- 7619.2%Structure Fires
- 153.8%Other
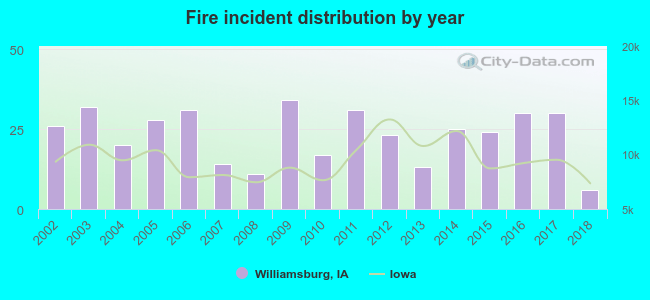 Based on the data from the years 2002 - 2018 the average number of fires per year is 23. The highest number of reported fires - 34 took place in 2009, and the least - 6 in 2018. The data has a declining trend.
 25.1% incidents where reported in the morning and 74.9% in the evening. The most fires (18.5%) took place on Saturday, and the least (12.2%) on Thursday.
 Based on the 395 fire incident reports from years 2002 - 2018 most fires (18.0%) took place during April, and the least (4.1%) in August.
 Out of all 582 cases reported during the years 2002 - 2018, the most belonged to the categories: Fire (67.9%), Hazardous Condition (12.4%), and Good Intent Call (6.4%).
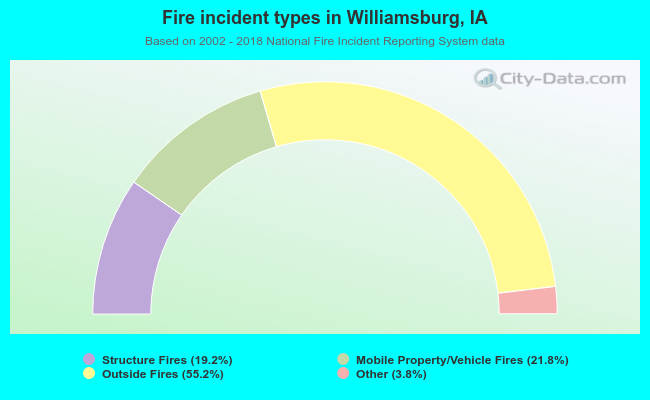 When looking into fire subcategories, the most reports belonged to: Outside Fires (55.2%), and Mobile Property/Vehicle Fires (21.8%).