| Fire incidents reported |
|---|
| Sreet name | Count |
|---|
| CO RT 17 | 16 | | COUNTY ROUTE 30 | 16 | | LITTLE POND RD | 16 | | ST RT 13 | 16 | | COUNTY ROUTE 17 | 14 | | ST RT 69 | 12 | | STATE ROUTE 13 | 12 | | RICARD RD | 10 | | CO RT 19 | 8 | | MELLON RD | 8 | | WHEELER RD | 8 | | 572 ST RT 13 | 6 | | BIRMINGHAM DR | 6 | | CO RT 30 | 6 | | KASOAG LAKE RD | 6 | | NICHOLS RD | 6 | | STATE ROUTE 69 | 6 | | STONE HILL RD | 6 | | COUNTY ROUTE 17 RT | 4 | | COUNTY RTE 30 | 4 | | FRANK BRYANT RD | 4 | | NICHOLS RD | 4 | | STATE ROUTE 183 | 4 | | STATE RTE 13 | 4 | | WHEELER RD | 4 |
| | | Fire incidents reported |
|---|
| Sreet name | Count |
|---|
| 125 CHILTON RD | 2 | | 1299 ST RT 13` | 2 | | 183 RT | 2 | | 200 BASE BRIDGE RD | 2 | | 245 BASE BRIDGE RD | 2 | | 25 CC RD | 2 | | 2823 CO RT 17 | 2 | | 3200 CO RT17 | 2 | | 38 MEIRS RD | 2 | | 46 CO RT 30 | 2 | | 48 CONE POND RD | 2 | | 512 ST RT 13 | 2 | | 540 CABLE RD | 2 | | 553 ST RT 13 | 2 | | 59 MORGAN RD | 2 | | 59 MORGON RD | 2 | | 764 CO RT 30 | 2 | | 960 ST RT 13 | 2 | | 976 ST RT 13 | 2 | | AMBOY RD | 2 | | BASE BRIDGE RD | 2 | | BEAVERLODGE RD | 2 | | BIRMINGHAM ROAD RD | 2 | | CC RD | 2 | | |
|
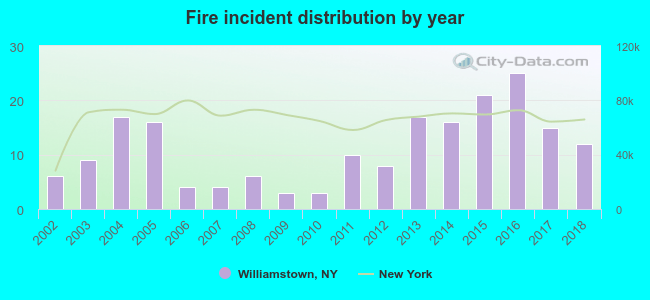 Based on the data from the years 2002 - 2018 the average number of fires per year is 11. The highest number of fire incidents - 25 took place in 2016, and the least - 3 in 2009. The data has a rising trend.
 28.6% incidents where reported in the morning and 71.4% in the evening. The most fires (19.3%) took place on Thursday, and the least (9.4%) on Monday.
 According to the 192 incident reports from years 2002 - 2018 most fires (14.6%) took place during April, and the least (1.6%) in October.
 Out of all 2,283 cases reported during the years 2002 - 2018, the most belonged to the categories: Rescue & EMS (54.8%), Good Intent Call (22.4%), and Hazardous Condition (10.8%).
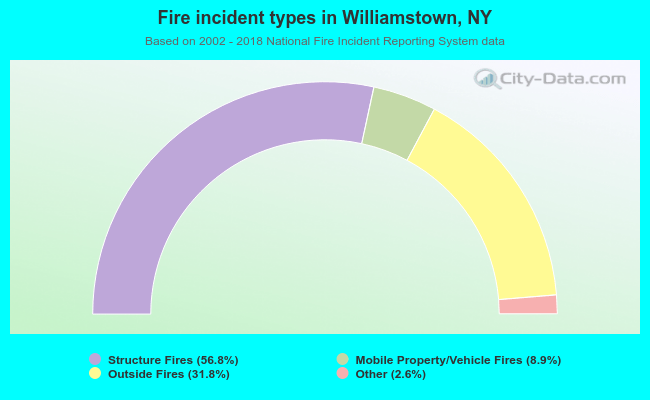 When looking into fire subcategories, the most reports belonged to: Structure Fires (56.8%), and Outside Fires (31.8%).