| Fire incidents reported |
|---|
| Sreet name | Count |
|---|
| LAKE RD | 24 | | DORWOOD PARK ST | 22 | | BEEBE RD | 20 | | MAPLE RD | 16 | | WILSONCAMBRIA RD | 16 | | CHESTNUT RD | 12 | | IDE RD | 12 | | LAKE ST | 10 | | RANDALL RD | 10 | | BRAYLEY RD | 8 | | DANIELS RD | 8 | | NEW RD | 8 | | HARWOOD AVE | 6 | | SHADIGEE RD | 6 | | SUNSET ISLAND | 6 | | WILLOW RD | 6 | | BRALEY RD | 4 | | LAKE RD. | 4 | | NELSON RD | 4 | | WILSON-CAMBRIA RD | 4 | | YOUNG ST | 4 | | 2384 HARWOOD AVE | 2 | | 2522 DANIELS RD | 2 | | 3278 LAKE RD | 2 | | 4512 WEST LAKE RD | 2 |
| | | Fire incidents reported |
|---|
| Sreet name | Count |
|---|
| 4630 LAKE RD | 2 | | BEBE AND IDE RD | 2 | | DANIALS RD | 2 | | DORWOOD PARK | 2 | | GERMAN RD | 2 | | HANER ST | 2 | | LAKE | 2 | | LAKE RD | 2 | | LAKE RDS | 2 | | LAKE ST | 2 | | LOCKPORT-OLCOTT RD | 2 | | LOCKPORTYOUNGSTOWN RD | 2 | | MECHANIC ST | 2 | | NORTH BEEBE RD | 2 | | NORTH RD | 2 | | O'CONNELL ISLAND | 2 | | RANDALL ROAD RD | 2 | | RIDGE RD | 2 | | SEE WILSON FIRE CO. FOR THIS R | 2 | | SHORE DR | 2 | | WILSON-YOUNGSTOWN RD | 2 | | WILSONBURT RD | 2 | | WILSONBURT RD | 2 | | WILSONYOUNGSTOWN RD | 2 | | |
|
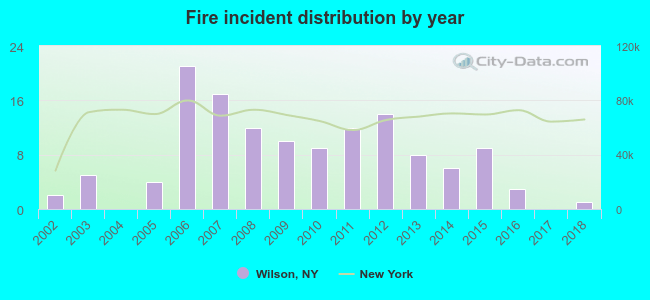 Based on the data from the years 2002 - 2018 the average number of fires per year is 8. The highest number of fire incidents - 21 took place in 2006, and the least - 0 in 2004. The data has a declining trend.
 38.3% incidents where reported in the morning and 61.7% in the evening. The most fires (21.1%) took place on Sunday, and the least (9.0%) on Friday.
 According to the 133 incident reports from years 2002 - 2018 most fires (12.0%) took place during March, and the least (5.3%) in September.
 Out of all 1,209 cases reported during the years 2002 - 2018, the most belonged to the categories: Rescue & EMS (52.1%), Hazardous Condition (11.9%), and Fire (11.0%).
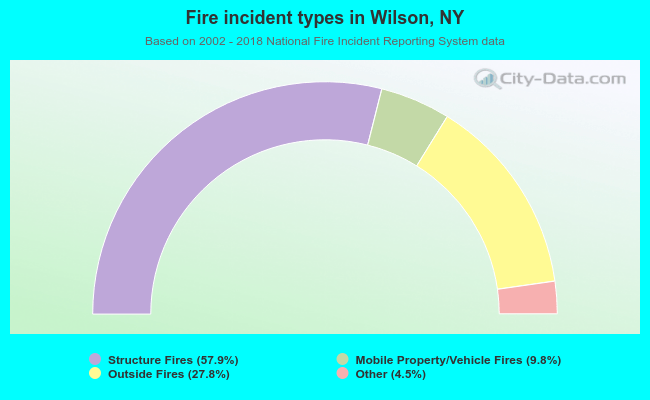 When looking into fire subcategories, the most reports belonged to: Structure Fires (57.9%), and Outside Fires (27.8%).