Wimauma: Fire Incidents, Florida (FL)
Where are fire incidents reported in Wimauma, FL
Something went wrong! Please refresh the page.
|
| |||||||||||||||||||||||||||||||||||||||||||||||||||||||||||||||||||||||||||||||||||||||||||||||||||||||||||||
2010 - 2018 National Fire Incident Reporting System (NFIRS) incidents
- Incident types reported to NFIRS in Wimauma, FL
- 2,27571.2%Rescue & EMS
- 37911.9%Fire
- 2337.3%Good Intent Call
- 1193.7%Service Call
- 1023.2%Hazardous Condition
- 752.3%False Alarm
- 110.3%Special Incident
- Fire incident types reported to NFIRS in Wimauma, FL
- 21857.5%Outside Fires
- 9124.0%Structure Fires
- 6316.6%Mobile Property/Vehicle Fires
- 71.8%Other
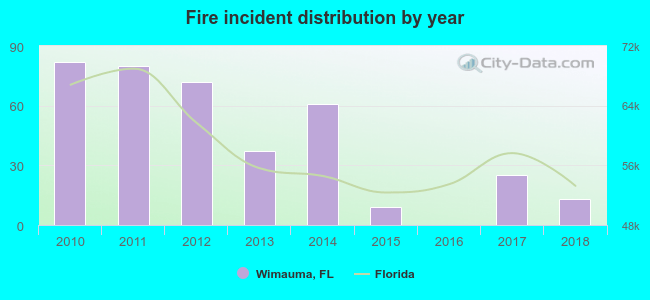 Based on the data from the years 2010 - 2018 the average number of fire incidents per year is 42. The highest number of reported fire incidents - 82 took place in 2010, and the least - 0 in 2016. The data has a dropping trend.
The average number of yearly fire incidents per 10k residents in Wimauma, FL compared to nearest cities:
(Note: Based on data for the last 3 years, including only cities with population 5,000 and above)
| Wimauma: | 29.8 |
| Sun City Center: | 5.7 |
| Ruskin: | 20.0 |
| Apollo Beach: | 4.6 |
| Gibsonton: | 12.3 |
| Parrish: | 46.8 |
| Riverview: | 4.0 |
| Bloomingdale: | 1.8 |
| Brandon: | 3.5 |
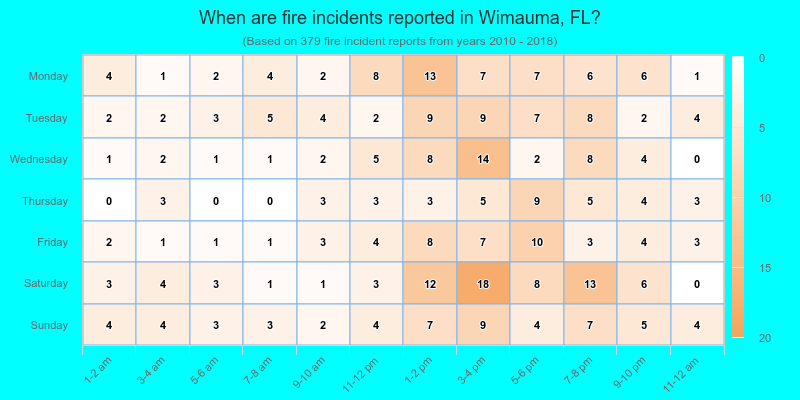
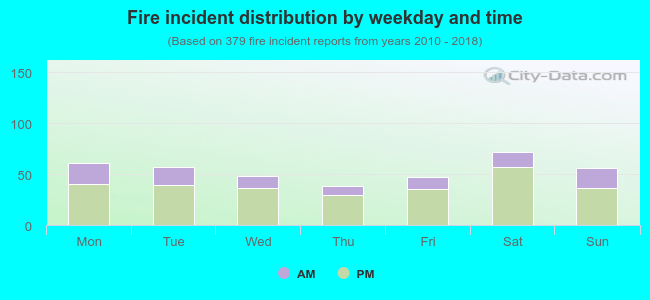 28.2% incidents where reported in the morning and 71.8% in the evening. The most fires (19.0%) took place on Saturday, and the least (10.0%) on Thursday.
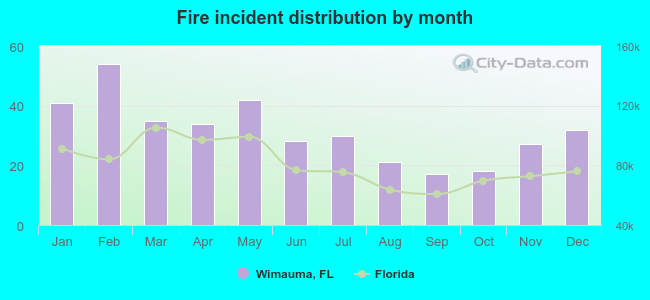 Based on the 379 incident reports from years 2010 - 2018 most fires (14.2%) took place during February, and the least (4.5%) in September.
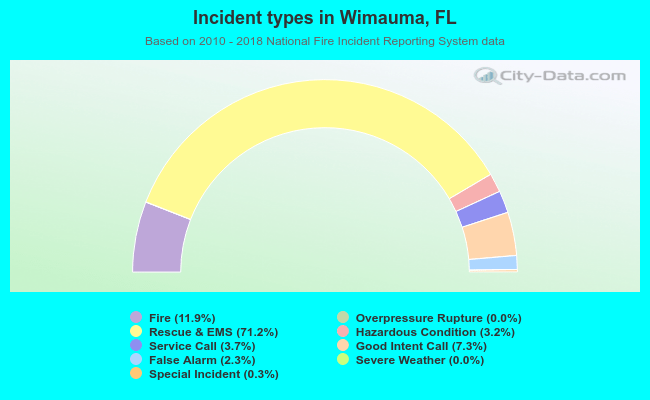 Out of all 3,196 cases reported during the years 2010 - 2018, the most belonged to the categories: Rescue & EMS (71.2%), Fire (11.9%), and Good Intent Call (7.3%).
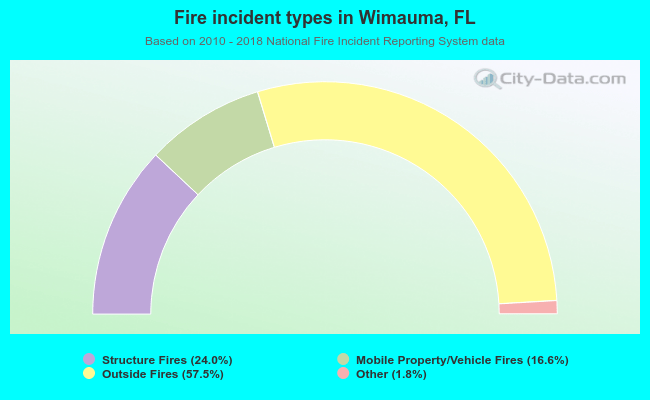 When looking into fire subcategories, the most reports belonged to: Outside Fires (57.5%), and Structure Fires (24.0%).