Windsor: Fire Incidents, New York (NY)
Where are fire incidents reported in Windsor, NY
Something went wrong! Please refresh the page.
|
| |||||||||||||||||||||||||||||||||||||||||||||||||||||||||||||||||||||||||||||||||||||||||||||||||||||||||||||
2002 - 2018 National Fire Incident Reporting System (NFIRS) incidents
- Incident types reported to NFIRS in Windsor, NY
- 28429.6%Fire
- 21222.1%Hazardous Condition
- 18919.7%Rescue & EMS
- 12212.7%Service Call
- 889.2%Good Intent Call
- 464.8%False Alarm
- 131.4%Severe Weather
- 30.3%Special Incident
- 10.1%Overpressure Rupture
- Fire incident types reported to NFIRS in Windsor, NY
- 16257.0%Structure Fires
- 6623.2%Outside Fires
- 4014.1%Mobile Property/Vehicle Fires
- 165.6%Other
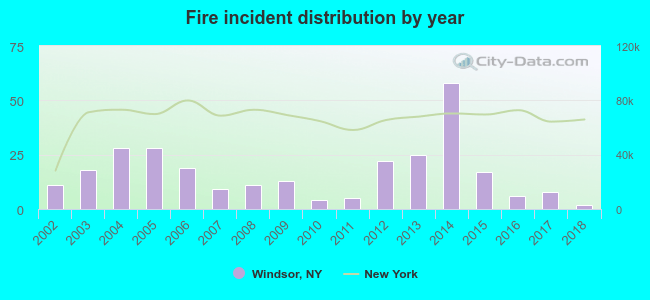 According to the data from the years 2002 - 2018 the average number of fires per year is 17. The highest number of fires - 58 took place in 2014, and the least - 2 in 2018. The data has a dropping trend.
 33.8% incidents where reported in the morning and 66.2% in the evening. The most fires (19.7%) took place on Monday, and the least (9.9%) on Wednesday.
 Based on the 284 reports from years 2002 - 2018 most fires (16.9%) took place during April, and the least (3.2%) in September.
 Out of all 958 cases reported during the years 2002 - 2018, the most belonged to the categories: Fire (29.6%), Hazardous Condition (22.1%), and Rescue & EMS (19.7%).
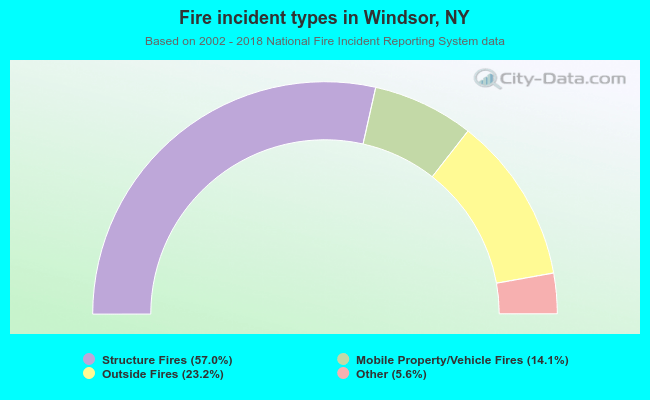 When looking into fire subcategories, the most reports belonged to: Structure Fires (57.0%), and Outside Fires (23.2%).