Windsor: Fire Incidents, Pennsylvania (PA)
Where are fire incidents reported in Windsor, PA
Something went wrong! Please refresh the page.
|
| |||||||||||||||||||||||||||||||||||||||||||||||||||||||||||||||||||||||||||||||||||||||||||||||||||||||||||||
2002 - 2018 National Fire Incident Reporting System (NFIRS) incidents
- Incident types reported to NFIRS in Windsor, PA
- 42138.3%Hazardous Condition
- 36533.2%Fire
- 968.7%Service Call
- 918.3%Good Intent Call
- 797.2%Rescue & EMS
- 272.5%False Alarm
- 201.8%Special Incident
- Fire incident types reported to NFIRS in Windsor, PA
- 21960.0%Structure Fires
- 10829.6%Outside Fires
- 226.0%Other
- 164.4%Mobile Property/Vehicle Fires
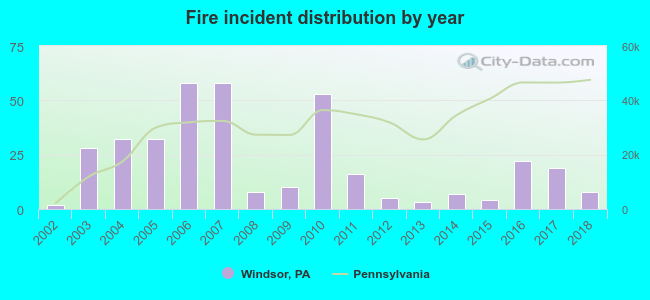 According to the data from the years 2002 - 2018 the average number of fire incidents per year is 21. The highest number of reported fires - 58 took place in 2006, and the least - 2 in 2002. The data has a growing trend.
 38.1% incidents where reported in the morning and 61.9% in the evening. The most fires (21.1%) took place on Saturday, and the least (11.0%) on Thursday.
 Based on the 365 fire incidents from years 2002 - 2018 most fires (14.5%) took place during January, and the least (4.1%) in June.
 Out of all 1,100 cases reported during the years 2002 - 2018, the most belonged to the categories: Hazardous Condition (38.3%), Fire (33.2%), and Service Call (8.7%).
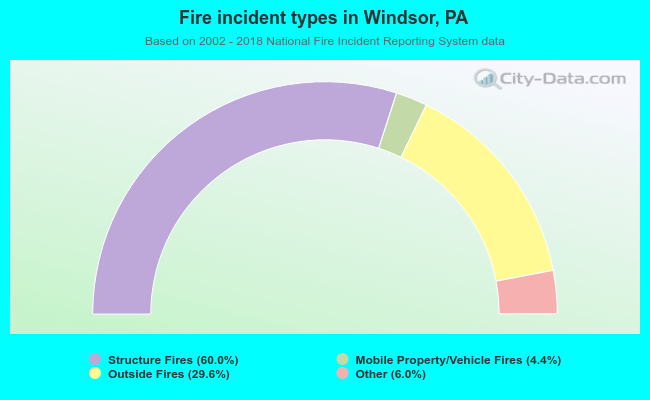 When looking into fire subcategories, the most reports belonged to: Structure Fires (60.0%), and Outside Fires (29.6%).