| Fire incidents reported |
|---|
| Sreet name | Count |
|---|
| MX RANCH ROAD | 28 | | US HWY 281 | 28 | | FM 174 | 22 | | FM 2581 | 22 | | US 281 | 22 | | HOFF ROAD | 16 | | OLIVER ROAD | 14 | | PREDEAUX ROAD | 14 | | ST HWY 16 | 14 | | BRIDWELL RANCH ROAD | 10 | | FM 172 | 10 | | LOFTIN ROAD | 10 | | LINDEMANN ROAD | 8 | | MUNCHRATH ROAD | 8 | | VEITENHEIMER ROAD | 8 | | ZOTZ ROAD | 8 | | BARRY ROAD | 6 | | COBB ROAD | 6 | | LOFTIN RD | 6 | | MATLOCK ROAD | 6 | | OLIVER RD | 6 | | OLIVERWELLS ROAD | 6 | | PRIDEAUX ROAD | 6 | | SCALING ROAD | 6 | | STATE HWY 16 | 6 |
| | | Fire incidents reported |
|---|
| Sreet name | Count |
|---|
| WOLF ROAD | 6 | | 3008 VEITENHEIMER ROAD | 4 | | 3MI. S. OF WINDTHORST ON US281 | 4 | | BEREND ROAD | 4 | | CONRADY ROAD | 4 | | FM174 | 4 | | HOFF RD. | 4 | | HWY 281 | 4 | | KINDER ROAD | 4 | | MCMURTRY RD | 4 | | MCMURTRY ROAD | 4 | | MUNCHRATH RD | 4 | | OLIVER WELLS ROAD | 4 | | PEYSEN ROAD | 4 | | SCHREIBER RD | 4 | | SCHREIBER ROAD | 4 | | ST HWY 25 | 4 | | STATE HWY 25 | 4 | | US HWY. 281 | 4 | | WESTFORK ROAD | 4 | | 1/2 MILE SOUTH ON WOLF RD. | 2 | | 102 BEREND ACRES | 2 | | 10285 N HWY 25 | 2 | | 1120 SCHREIBER ROAD | 2 | | |
|
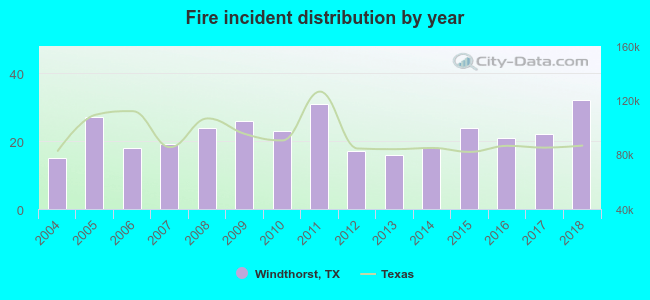 According to the data from the years 2004 - 2018 the average number of fire incidents per year is 22. The highest number of reported fire incidents - 32 took place in 2018, and the least - 15 in 2004. The data has a rising trend.
 23.7% incidents where reported in the morning and 76.3% in the evening. The most fires (15.9%) took place on Monday, and the least (12.3%) on Friday.
 Based on the 333 fire incident reports from years 2004 - 2018 most fires (15.6%) took place during July, and the least (3.6%) in November.
 Out of all 647 cases reported during the years 2004 - 2018, the most belonged to the categories: Fire (51.5%), Overpressure Rupture (42.5%), and Hazardous Condition (5.1%).
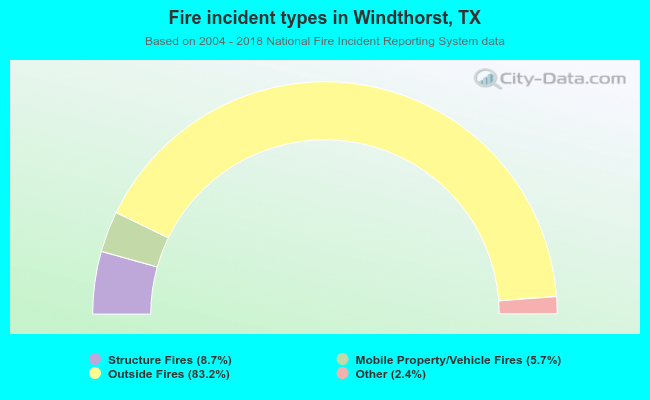 When looking into fire subcategories, the most incidents belonged to: Outside Fires (83.2%), and Structure Fires (8.7%).