| Fire incidents reported |
|---|
| Sreet name | Count |
|---|
| PINE GROVE RD | 10 | | ISHAM RD | 8 | | NEW LIGHT RD | 8 | | 130 ADKINS TRAIL | 6 | | 26153 SCOTT HIGHWAY | 6 | | 26383 SCOTT HWY | 6 | | 2900 KINGTOWN RD | 6 | | 333 THOMPSON TRAIL | 6 | | 509 NEW LIGHT RD | 6 | | KINGTOWN RD | 6 | | RAMSEY RD | 6 | | 1053 NEWLIGHT RD | 4 | | 1155 ABBOTT RD | 4 | | 1181 NEWLIGHT ROAD | 4 | | 1187 CLAY HILL ROAD | 4 | | 1315 KINGTOWN RD | 4 | | 138 BRIDGES RD | 4 | | 160 EAST ISHAM RD | 4 | | 1681 KINGTOWN RD | 4 | | 170 TRAMMELL CEM RD | 4 | | 192 WEST ISHAM RD | 4 | | 196 VIRGINIA LN | 4 | | 2039 PLEASANT GROVE RD | 4 | | 208 CL WRIGHT LN | 4 | | 210 CONIFER TRAIL | 4 |
| | | Fire incidents reported |
|---|
| Sreet name | Count |
|---|
| 2405 KINGTOWN RD | 4 | | 25278 SCOTT HWY | 4 | | 26575 SCOTT HWY | 4 | | 26703 SCOTT HWY | 4 | | 27145 SCOTT HWY | 4 | | 310 CLAY HILL RD | 4 | | 361 CLAY HILL ROAD | 4 | | 371 STRUNK RD | 4 | | 414 CLIFTY CREEK TRAIL | 4 | | 420 ANDY LN | 4 | | 467 PINE GROVE RD | 4 | | 5880 GUM FORK RD | 4 | | 631 CLAY HILL RD | 4 | | 797 PED RD | 4 | | 850 BART GRANT HOLLOW RD | 4 | | ADKINS TRL | 4 | | ANDY LN | 4 | | HWY 27 | 4 | | PLEASANT GROVE RD | 4 | | PLEASANT GROVE RD | 4 | | POPULAR LN | 4 | | SCOTT HWY | 4 | | 106 SLAVEN DRIVE | 2 | | 1112 POPLAR LN | 2 | | 1135 ANGEL VALLEY RD | 2 |
|
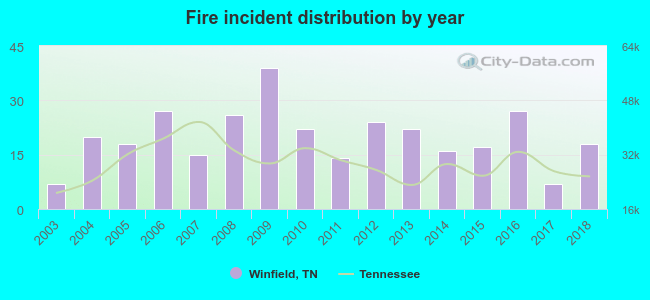 Based on the data from the years 2003 - 2018 the average number of fire incidents per year is 20. The highest number of fires - 39 took place in 2009, and the least - 7 in 2003. The data has an increasing trend.
 37.0% incidents where reported in the morning and 63.0% in the evening. The most fires (15.7%) took place on Monday, and the least (12.9%) on Tuesday.
 Based on the 319 incident reports from years 2003 - 2018 most fires (16.9%) took place during March, and the least (3.8%) in May.
 Out of all 479 cases reported during the years 2003 - 2018, the most belonged to the categories: Fire (66.6%), Overpressure Rupture (12.3%), and Rescue & EMS (9.0%).
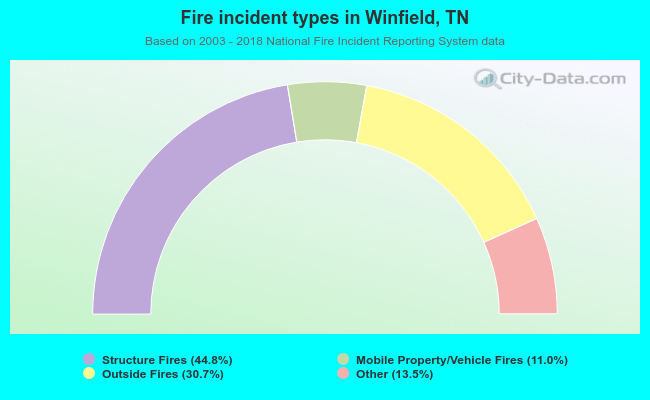 When looking into fire subcategories, the most incidents belonged to: Structure Fires (44.8%), and Outside Fires (30.7%).