| Fire incidents reported |
|---|
| Sreet name | Count |
|---|
| WINFIELD ROAD | 34 | | WINFIELD RD | 28 | | 3749 WINFIELD ROAD RD | 22 | | RT 34 | 16 | | WINFIELD ROAD RD | 16 | | RT 35 | 10 | | STATE ROUTE 34 | 10 | | ROCKY STEP RD | 8 | | RT 817 | 8 | | VALLEY ST | 8 | | WINFIELD RD | 8 | | WOODLAND FOREST | 8 | | 6175 ST RT 34 | 6 | | BILLS CREEK ROAD | 6 | | BLUE LICK RD | 6 | | BLUE LICK ROAD | 6 | | MORRIS AVE. | 6 | | ROCKY STEP RD | 6 | | ROCKY STEP ROAD | 6 | | STATE RT 34 | 6 | | WINFIELD AVENUE | 6 | | 128 CEDARWAY | 4 | | 1530 WINFIELD RD | 4 | | 3259 WINFIELD RD. RD | 4 | | 35 RT | 4 |
| | | Fire incidents reported |
|---|
| Sreet name | Count |
|---|
| 3749 WINFIELD RD RD | 4 | | 6954 WINFIELD RD | 4 | | BILLS CREEK | 4 | | BLUE LICK RD | 4 | | CONNIE LANE | 4 | | CONNIE LN | 4 | | CROSS CIR | 4 | | DEERFIELD DR | 4 | | HARMONS BR | 4 | | JERICHO RD | 4 | | JERRICO RD | 4 | | JOSHUA WAY | 4 | | MARSHALL MANOR | 4 | | RIVERDALE ESTS | 4 | | ROBS CANYON | 4 | | ROCKY STEP ROAD RD | 4 | | RT 35 RT | 4 | | ST RT 34 | 4 | | STEWART ACRES | 4 | | WINFIELD MOBILE HOME VILLAGE | 4 | | WINFIELD RD RD | 4 | | 1 WALL STREET | 2 | | 10 SCOTT LANE | 2 | | 10427 WINFIELD RD | 2 | | |
|
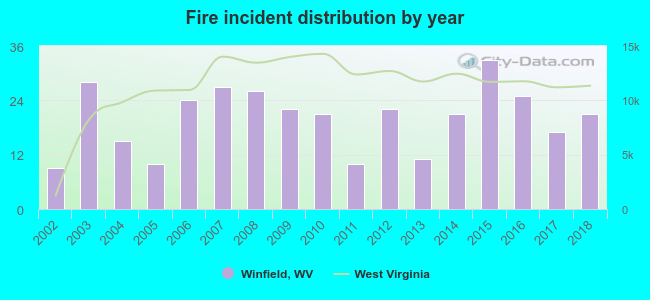 According to the data from the years 2002 - 2018 the average number of fires per year is 20. The highest number of fires - 33 took place in 2015, and the least - 9 in 2002. The data has an increasing trend.
 37.1% incidents where reported in the morning and 62.9% in the evening. The most fires (17.0%) took place on Monday, and the least (9.9%) on Thursday.
 Based on the 342 fires from years 2002 - 2018 most fires (12.9%) took place during January, and the least (4.1%) in September.
 Out of all 1,461 cases reported during the years 2002 - 2018, the most belonged to the categories: Rescue & EMS (29.1%), Fire (23.4%), and Overpressure Rupture (21.1%).
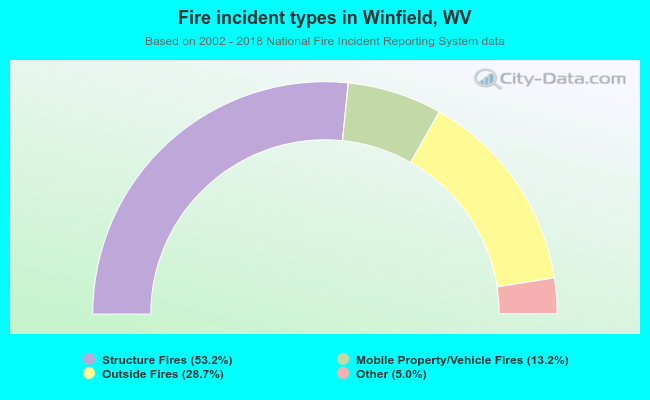 When looking into fire subcategories, the most reports belonged to: Structure Fires (53.2%), and Outside Fires (28.7%).