Winthrop: Fire Incidents, Minnesota (MN)
Where are fire incidents reported in Winthrop, MN
Something went wrong! Please refresh the page.
|
| |||||||||||||||||||||||||||||||||||||||||||||||||||||||||||||||||||||||||||||||||||||||||||||||||||||||||||||
| Other | 24 | |||||||||||||||||||||||||||||||||||||||||||||||||||||||||||||||||||||||||||||||||||||||||||||||||||||||||||||
2002 - 2018 National Fire Incident Reporting System (NFIRS) incidents
- Incident types reported to NFIRS in Winthrop, MN
- 18065.7%Fire
- 4315.7%Rescue & EMS
- 3512.8%Hazardous Condition
- 72.6%False Alarm
- 31.1%Service Call
- 31.1%Severe Weather
- 20.7%Overpressure Rupture
- 10.4%Good Intent Call
- Fire incident types reported to NFIRS in Winthrop, MN
- 7843.3%Structure Fires
- 5932.8%Outside Fires
- 3217.8%Mobile Property/Vehicle Fires
- 116.1%Other
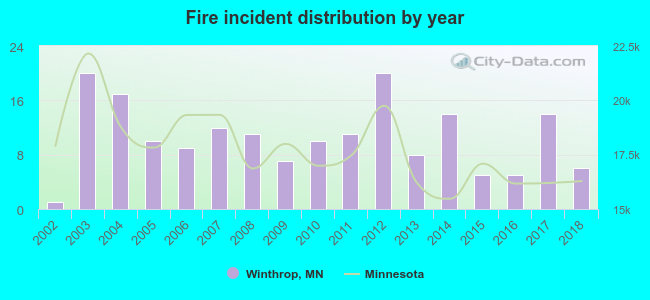 According to the data from the years 2002 - 2018 the average number of fire incidents per year is 11. The highest number of fires - 20 took place in 2003, and the least - 1 in 2002. The data has an increasing trend.
 42.2% incidents where reported in the morning and 57.8% in the evening. The most fires (20.6%) took place on Sunday, and the least (9.4%) on Tuesday.
 According to the 180 reports from years 2002 - 2018 most fires (16.7%) took place during April, and the least (2.2%) in February.
 Out of all 274 cases reported during the years 2002 - 2018, the most belonged to the categories: Fire (65.7%), Rescue & EMS (15.7%), and Hazardous Condition (12.8%).
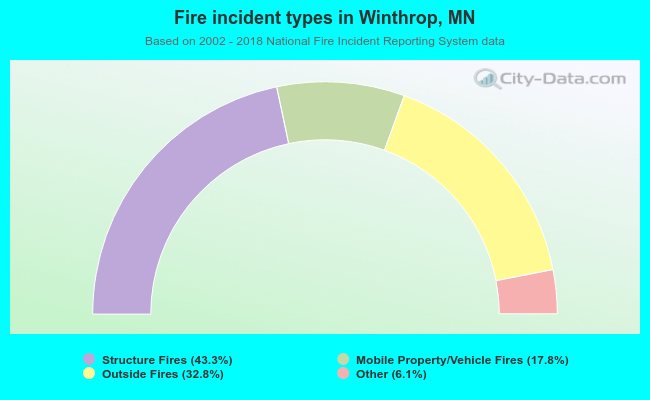 When looking into fire subcategories, the most incidents belonged to: Structure Fires (43.3%), and Outside Fires (32.8%).